Client Communication: Using Gantt Charts to Set Realistic Expectations
In client work, the hard conversations are rarely about how to build something. They’re about when it will be ready, and why a change the client sees as small moves the date. If you explain that in words, it can sound like an excuse. A chart makes the same point without anyone having to argue it: this task waits for that one, and that one waits for you.
This post is about using a Gantt chart for that conversation, and how we do it with Andamio: what to put in the plan, which view to show, and how to send it.
What a text proposal hides
Most projects start with a scope document: a list of deliverables and a final date. It says what will happen but not how the parts depend on each other. A client who can’t see that the brand assets block the whole front end will reasonably assume that two weeks’ delay on the assets still leaves the launch date alone.
A single-number estimate hides something else: the review rounds. “Four days” for a design rarely includes the three rounds of changes, the approval meeting and the week it sits in someone’s inbox. When those aren’t in the plan, the plan is wrong from the first day.
A Gantt chart shows both. Dependencies are arrows, and review time can be a visible part of each bar.
Put the client’s work in the plan
The client has tasks too: sending the copy, approving wireframes, giving access to an account. Put them in the plan as tasks, in a phase of their own if you like (“Client”), and link them to the work that waits for them. In Andamio you draw a dependency by dragging from the round handle on the side of one bar to another bar.
From then on, the effect of a delay on their side is visible to everyone. If “Approve wireframes” moves two days to the right, every task that depends on it moves with it. Andamio moves them automatically: each task starts when the last of its dependencies has finished. Dependencies are finish-to-start only. For what that does and doesn’t calculate, see the critical path post.
Make review time its own part of each task
Each task in Andamio has two numbers for the part of the work that isn’t the work itself:
- Buffer, in days, is your margin for what you can’t predict. It doesn’t touch the effort estimate.
- Validation complexity is the review time you can predict: the client asks for rounds of changes, legal has to sign off. It goes from 0 to 2 and adds
ceil(effort × validation complexity)days to the task.
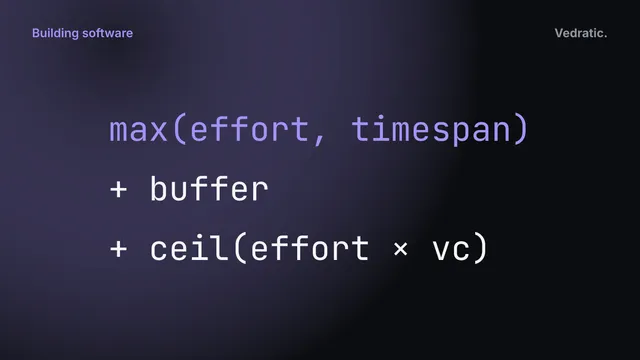
It adds to the task. It doesn’t multiply it. A design task with 4 days of effort and a validation complexity of 0.5 gets 2 extra days; at 2.0 it gets 8, for a total of 12. The full length is max(effort, timespan) + buffer + ceil(effort × validation complexity).
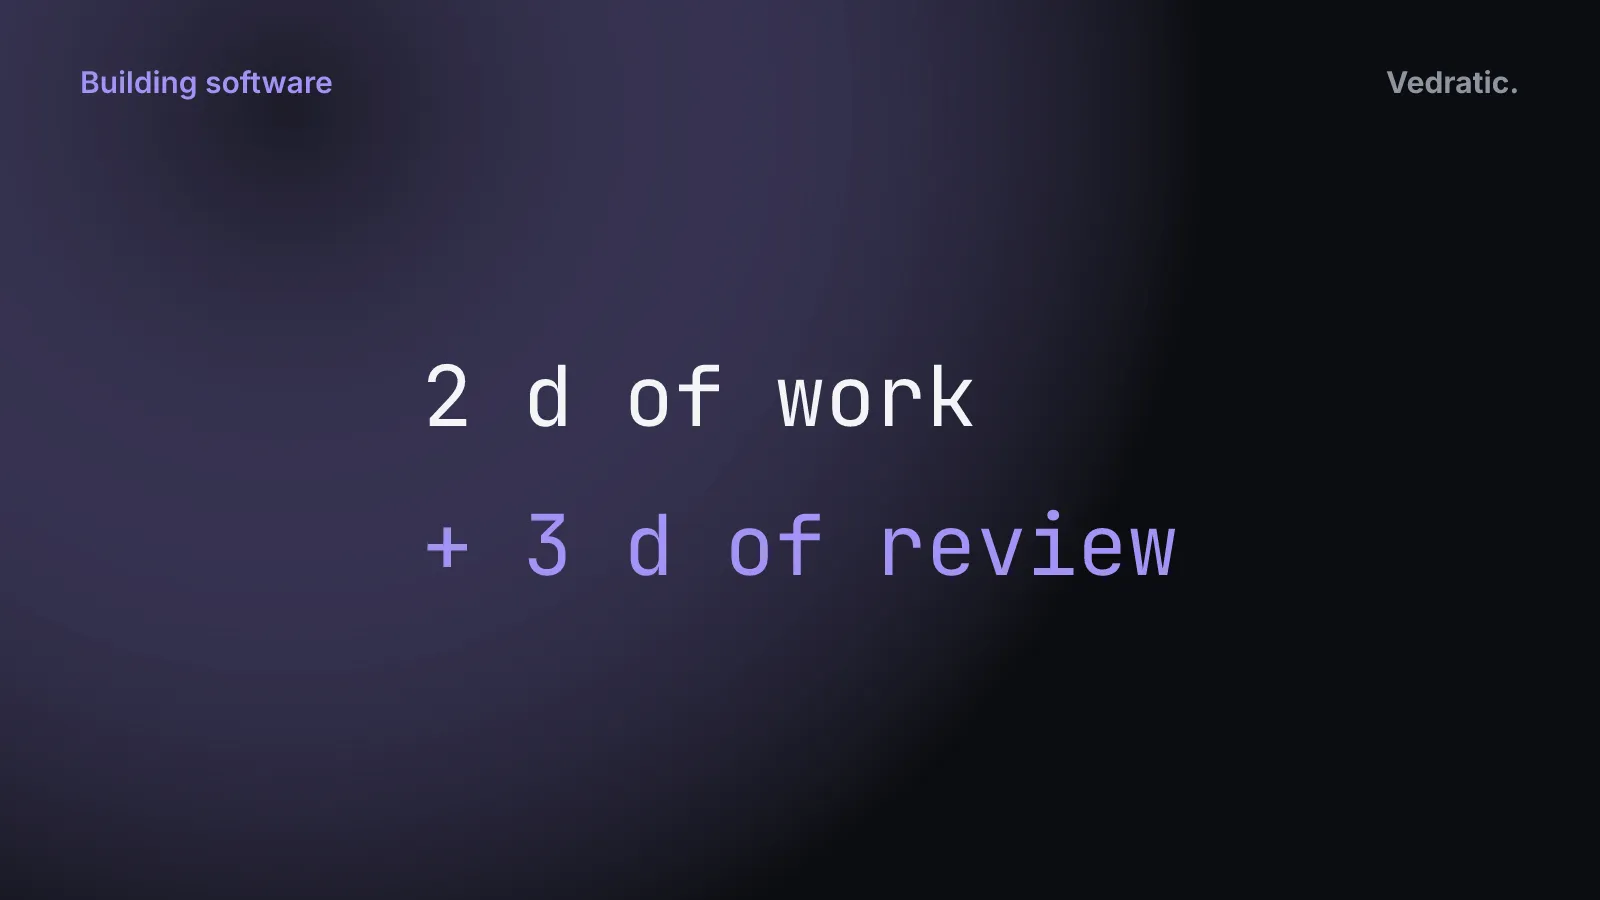
In the chart, each bar shows the parts separately: effort solid, review time striped, buffer dotted. When a client asks why a design takes twelve days, the bar answers: four of work, eight of back-and-forth. That’s usually a more productive conversation than defending a single number.
Be aware of one current limitation: the editor has no input field for validation complexity yet. It’s stored in the plan’s JSON as validationComplexity, so you set it by editing an exported file and importing it back. Buffer, effort and timespan have fields in the task list. For how to size buffers in the first place, see why your project needs buffer time built in and the project buffer calculator.
Show deliverables, not tasks
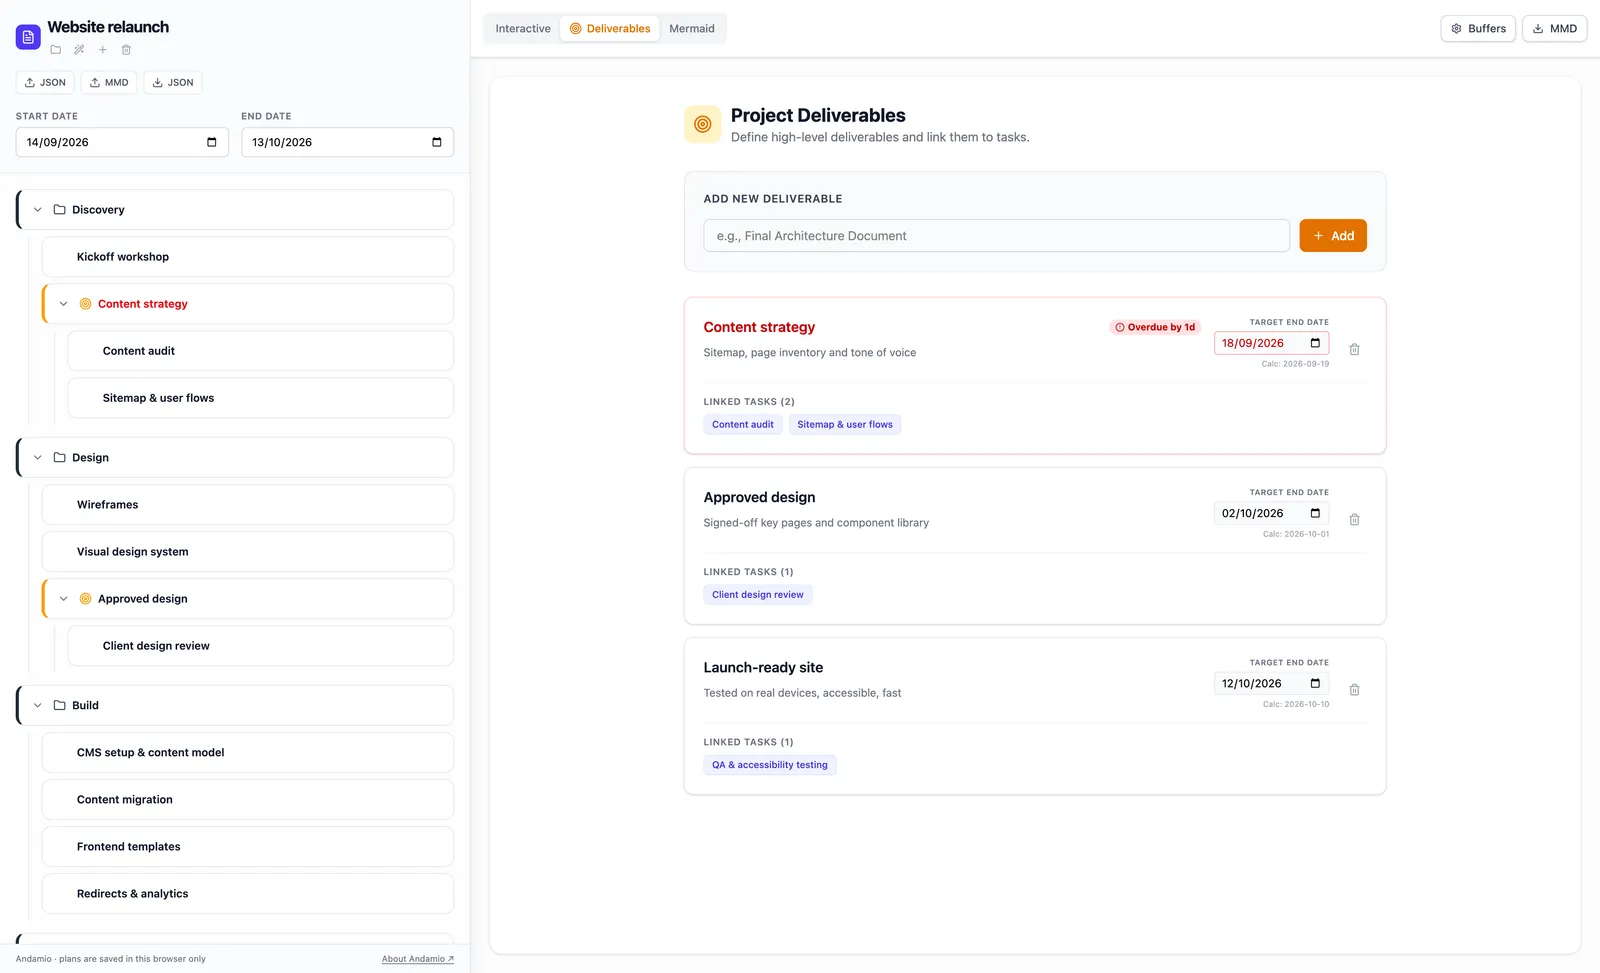
Clients usually care about what they’ll receive and when. They don’t care about your task list. The Deliverables view shows exactly that. Each deliverable has a name, a description, an optional target end date and the tasks linked to it (you link tasks to a deliverable from the chart). Andamio works out the date each deliverable will be ready from its tasks. If that date is later than the target, the card says “Overdue by N d”.
That’s a useful view to open during a call. You agree the target dates with the client, and from then on the view tells both of you, deliverable by deliverable, whether the plan still meets them.
Handling a change request
When the client asks for something new mid-project, you don’t have to argue about it. Open the plan, add the task, link it to what it depends on and to what depends on it, and watch the deliverable dates move. Then ask the question the chart makes obvious: move the date to fit it in, or leave it for a second phase?
The same applies when the shape of the plan is wrong. A typical launch has a short opening (research, decisions), a dense middle with several tracks in parallel, and a narrowing towards testing. In a chart, you can see at a glance when the testing window at the end has been squeezed to almost nothing, before it becomes a problem.
Sending the plan
Clients rarely want to open a planning tool. They want something to look at, or to put in a slide for their own manager. Andamio has three exports:
- SVG. In the Mermaid view there’s an SVG button that downloads the chart as a vector image. It stays sharp at any size in a slide or a PDF.
- Mermaid (
.mmd). The plan as Mermaid Gantt code, for a README on GitHub or a Notion page, which both render it as a chart. - JSON. The whole plan, if the client uses Andamio too. They import it into their own browser; there’s no shared copy.
Check the Mermaid view before you send an SVG, because the Mermaid export is a simplified copy of the plan. Buffer and review time are included in each task’s length, but manual offsets aren’t exported, tasks nested inside a deliverable within a phase are left out, and a deliverable with no dependencies of its own is drawn on the project start date. If your plan uses those, the Interactive view is the accurate one. We go through the details in how Andamio works.
Task statuses carry over. In Progress, Done and Blocked become Mermaid’s active, done and crit, so the exported chart shows what’s finished and what’s stuck.
Where to start
The next time a client asks for a date, open Andamio, put their tasks next to yours, and show them the Deliverables view before you send anything. For the arithmetic of what happens when the same people work on several clients at once, see the fallacy of multitasking.