The Fallacy of Multitasking in Project Planning
Resource plans often contain a row like this: one developer, three projects, 33% each. On paper it looks efficient. The person is fully allocated, three projects can each say someone is working on them, and nobody has to be told to wait.
The arithmetic says otherwise, even before counting the cost of switching between projects. This post works through it, adds the best-known estimate of what switching costs, and shows how to write partial dedication into a plan in Andamio, with one clear limit: Andamio doesn’t model how loaded each person is.
Sequential vs split: the arithmetic
Take three projects, A, B and C. Each needs 10 working days from the same person, and each is worth something only once it’s finished.
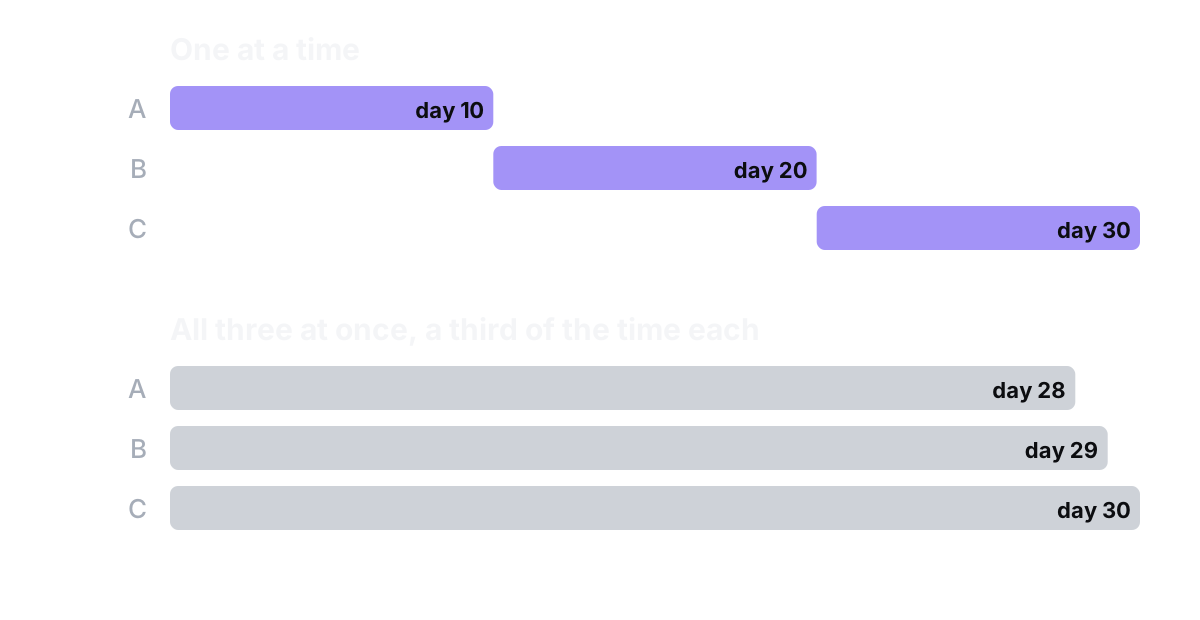
Done one after another:
- A is finished on day 10.
- B is finished on day 20.
- C is finished on day 30.
Split, one day each in turn (A, B, C, A, B, C…):
- A gets its tenth day on day 28.
- B gets its tenth day on day 29.
- C gets its tenth day on day 30.
The total is the same, 30 days of work, and C finishes on day 30 either way. What changes is everything before that. Splitting delays A by 18 days and B by 9, and for the first 27 days nothing is finished at all. If each project starts paying off when it ships, the split plan gives up almost a month of A’s value and more than a week of B’s, in exchange for the feeling that all three are moving.
This assumes switching costs nothing. It doesn’t.
What switching costs
Changing projects means reloading a different codebase and a different set of decisions, and catching up on what happened while you were away. The most-quoted estimate of that cost comes from the computer scientist and consultant Gerald M. Weinberg, in Quality Software Management, Vol. 1: Systems Thinking (Dorset House, 1992). His table gives the share of time left for each project when one person works on several at once:
| Projects at once | Time per project | Lost to switching |
|---|---|---|
| 1 | 100% | 0% |
| 2 | 40% | 20% |
| 3 | 20% | 40% |
| 4 | 10% | 60% |
| 5 | 5% | 75% |
These numbers are Weinberg’s rough estimates, not the result of a controlled experiment. Read them as an order of magnitude: each extra project costs more than the one before.
If you take the three-project row at face value, the split plan is worse than the arithmetic above. Each project gets 20% of the person’s time instead of 33%, so 10 days of work takes 50 working days instead of 30. The sequential plan still finishes A on day 10.
Why plans end up split anyway
Allocating someone at 33% to three projects avoids a conversation. The alternative is deciding which project goes first and telling the other two that they start later. A split allocation lets everyone avoid that decision, and the cost only shows up later, as dates that all slip together.
The standard fix has a name, resource levelling: resolving over-allocation by delaying or reassigning work until each person has a load they can actually carry. When someone is booked for more than 100%, there are two ways out:
- Reassign. Someone else takes one of the tasks. They may take longer (5 days where the original person would take 3), but the work runs in parallel and the project can still finish sooner.
- Sequence. If only that person can do the work, put B after A and accept that B’s date moves.
Levelling also answers the multitasking question. It means whole blocks in sequence (a week at 100% on A, then a week at 100% on B) instead of two hours a day on each of four projects.
Planning it in Andamio
Andamio has no people in it. You can’t assign a task to someone, it doesn’t add up anyone’s load, and it doesn’t warn you when a person is booked twice. A dedication percentage doesn’t affect any date. What it does have is two fields per task that let you write the consequences of dedication into the plan yourself:
- Effort is the work, in days.
- Timespan is the calendar time you give it.
The task’s length uses the larger of the two (plus buffer and review time: max(effort, timespan) + buffer + ceil(effort × validation complexity)). A timespan longer than the effort is how you say “this person isn’t on it full time”. Ten days of work at about a third of someone’s time is an effort of 10 and a timespan of 30. At Weinberg’s 20%, it’s a timespan of 50. The effort stays at 10, so review time, which is calculated from effort, doesn’t grow with the calendar.
For the sequential version, you give each project its full-time length and chain them: B depends on A, C depends on B. The chart then shows A finishing on day 10, and anyone looking at it can see why B hasn’t started.
Compare the two versions side by side. One way:
- Make the split version: three tasks, each with an effort of 10 and a timespan of 30, no dependencies. All three end on day 30.
- Duplicate the plan (export it as JSON and import it back), then change the copy to the sequential version: three tasks of 10 days, chained.
- Look at A’s end date in each. That difference is what the split costs before switching is even counted.
Two details to keep in mind. Andamio counts calendar days, weekends included, so “day 30” in the chart is 30 calendar days after the start. Convert working days before you type them. And since Andamio doesn’t know who does what, it’s up to you to make sure the same person isn’t in two parallel chains. If they are, the chart will show both finishing on time, and it’ll be wrong.
Where this leaves the plan
Sequential work, with the order agreed, finishes the first thing much sooner and loses less to switching. When partial dedication can’t be avoided, a plan that writes it down (as a timespan longer than the effort) at least shows the real dates instead of the hopeful ones.
For the critical tasks in particular, splitting time is where delays come from: see how to calculate the critical path. For the margin to add once the order is set, see why your project needs buffer time built in and the project buffer calculator.