Why Your Project Needs Buffer Time Built In
Douglas Hofstadter put the problem in one line in Gödel, Escher, Bach (1979): “It always takes longer than you expect, even when you take into account Hofstadter’s Law.” He was writing about chess programs. The line stuck because anyone who has planned a project has lived it.
A plan that only works if nothing goes wrong has no room for the things that always do: a review that takes three rounds, a dependency that arrives late, a bug that eats a week. A buffer is that room, written down. We’ve built buffers into two tools, and they work in different ways. This post explains both, and how they differ from the most famous buffer method, Critical Chain.
Parkinson’s point: hidden padding gets used
The usual objection to buffers is that people will just use them up. That objection has a source. On 19 November 1955 The Economist published a satirical essay by the naval historian C. Northcote Parkinson, “Parkinson’s Law”. Its opening line is the one everyone quotes: “Work expands so as to fill the time available for its completion.”
Most of the essay isn’t about individual work. It’s about bureaucracy: the number of officials grows whatever the amount of work, and Parkinson backed this with the British Admiralty, whose staff kept growing while the fleet shrank. The line about time is the setup for a joke about institutions, not a finding from a study. Parkinson later expanded the essay into a book.
As a planning lesson, it still makes a useful point. Padding hidden inside each estimate tends to get spent, because nobody can see it and nobody is responsible for it. The answer isn’t to remove the margin. It’s to make it visible, so everyone can see how much there is and when it’s being used.
The opposite mistake is just as real. Squeezing every estimate below what’s realistic doesn’t remove the uncertainty. It moves it to the end of the project, where it turns into a missed date.
Buffers in Andamio: a field in days
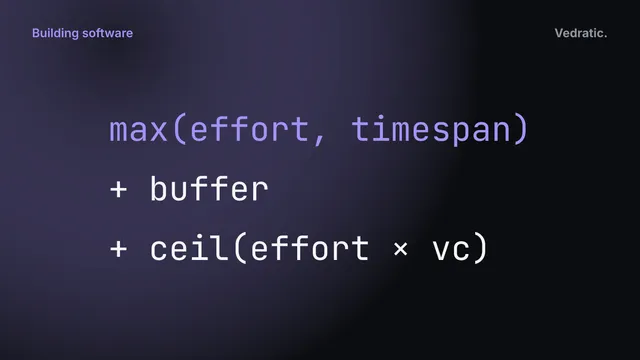
In Andamio, every task has four numbers that decide how long it is: effort, timespan, buffer and validation complexity. Its length in days is:
max(effort, timespan) + buffer + ceil(effort × validation complexity)That formula is in calculateSchedule in src/utils/scheduling.ts, and each part has a job:
- Effort is the work itself, in days.
- Timespan is the calendar time you give it, if that’s longer than the effort. A task with 3 days of work spread over a week has an effort of 3 and a timespan of 5.
- Buffer is your margin, in days, added by hand.
- Validation complexity is review time you know will happen. It goes from 0 to 2 and adds that fraction of the effort, rounded up: 0.5 adds half the effort, 1.0 the same again, 2.0 twice the effort.
Validation complexity adds to the length. It doesn’t multiply it. A task with 4 days of effort and a validation complexity of 2.0 lasts 4 + 8 = 12 days. A task with 4 days of effort, 1 day of buffer and a validation complexity of 0.5 lasts 4 + 1 + 2 = 7.
Keeping buffer and review time in separate fields is deliberate. A buffer covers what you can’t predict. Review time is what you can: a client who always asks for two rounds of changes, a legal check. In the chart, each bar shows the three parts as separate blocks: the base duration solid, the validation time striped and the buffer dotted. Hovering over a bar gives the breakdown in days. When a task looks long, you can see why.
Two practical details:
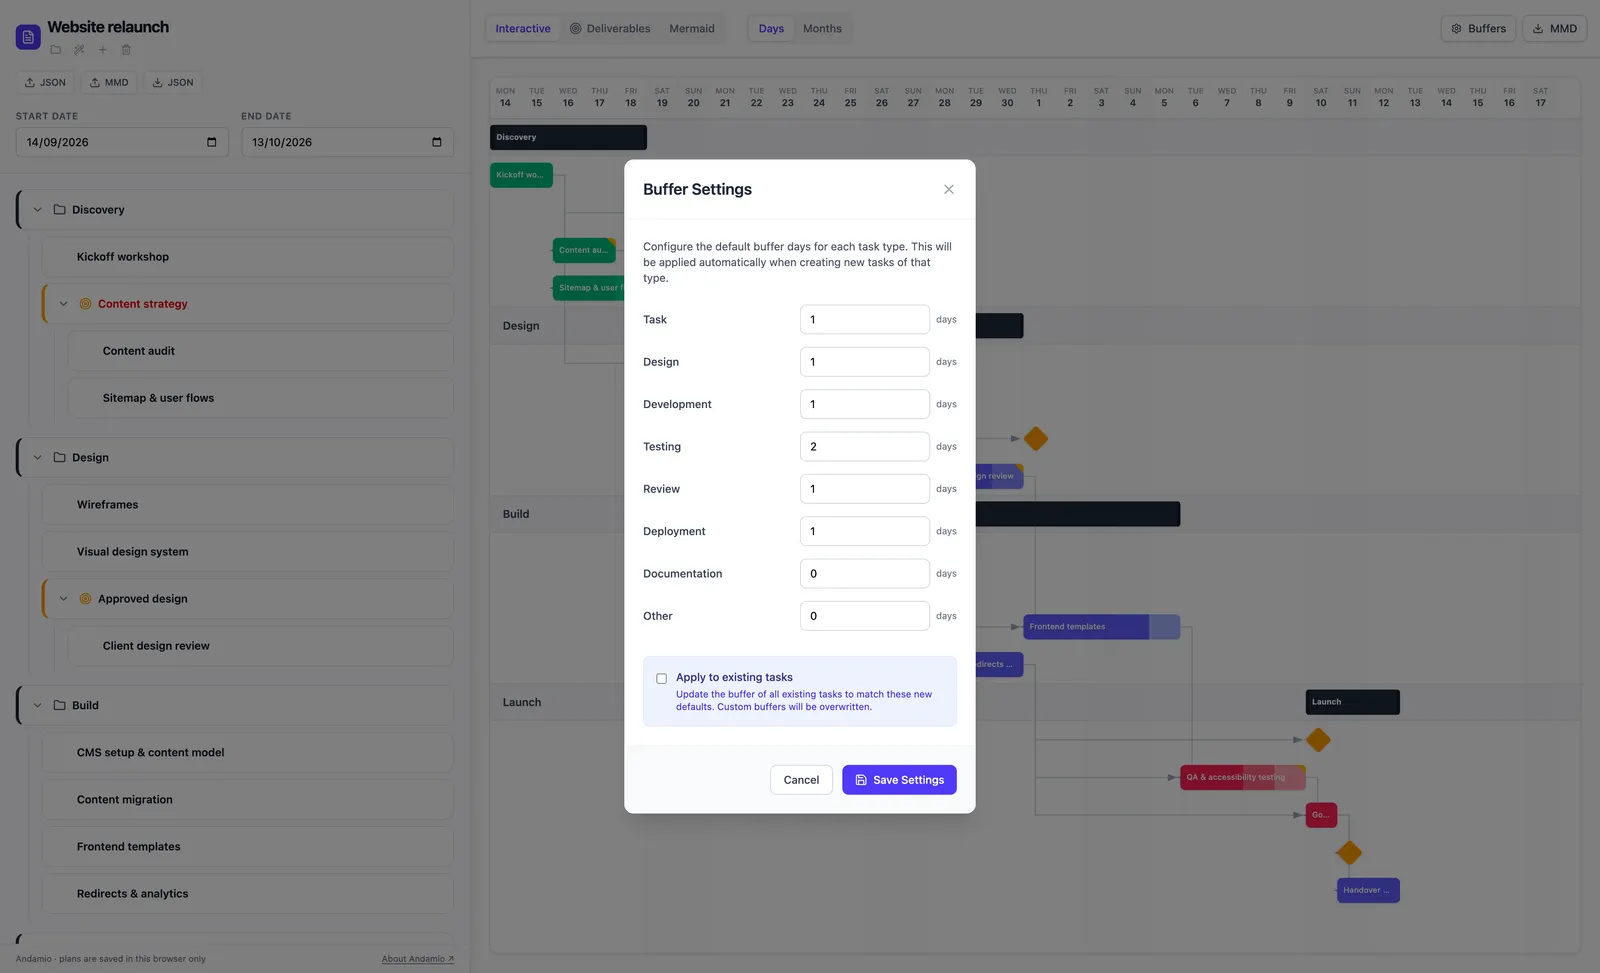
- Defaults per task type. The Buffers button in the toolbar sets a default number of days per type (Design, Development, Testing, Review, Deployment, Documentation and so on). The default is applied when you create a task of that type. There’s an option to apply new defaults to existing tasks, which overwrites buffers you set by hand.
- No field for validation complexity yet. The editor doesn’t have an input for it in the current version. It’s stored in the plan’s JSON as
validationComplexity, so today you set it by editing an exported file and importing it back. Buffer, effort and timespan have fields in the task list.
What Andamio doesn’t have is a separate project buffer. There’s no block at the end of the plan that the software tracks as a buffer. If you want one, add a task at the end of the chain called “Project buffer”, give it the days, and make the final milestone depend on it. The dates will be right. Andamio just won’t treat that task any differently from the others.
Buffers in the calculator: sized from uncertainty
The project buffer calculator takes a different route. Instead of asking you for a margin, it works one out from how unsure you are about each task.
For every task on the chain you give three estimates: optimistic (O), most likely (M) and pessimistic (P). The calculator then does three things.
1. Expected duration, with PERT. PERT came out of the US Navy’s Polaris programme; the method was published by Malcolm, Roseboom, Clark and Fazar in 1959. It weights the estimates towards the most likely one and uses the spread as a rough standard deviation:
t_e = (O + 4M + P) / 6 σ = (P − O) / 62. Project buffer, with the root sum of squares (RSS). The buffer goes once, at the end of the chain:
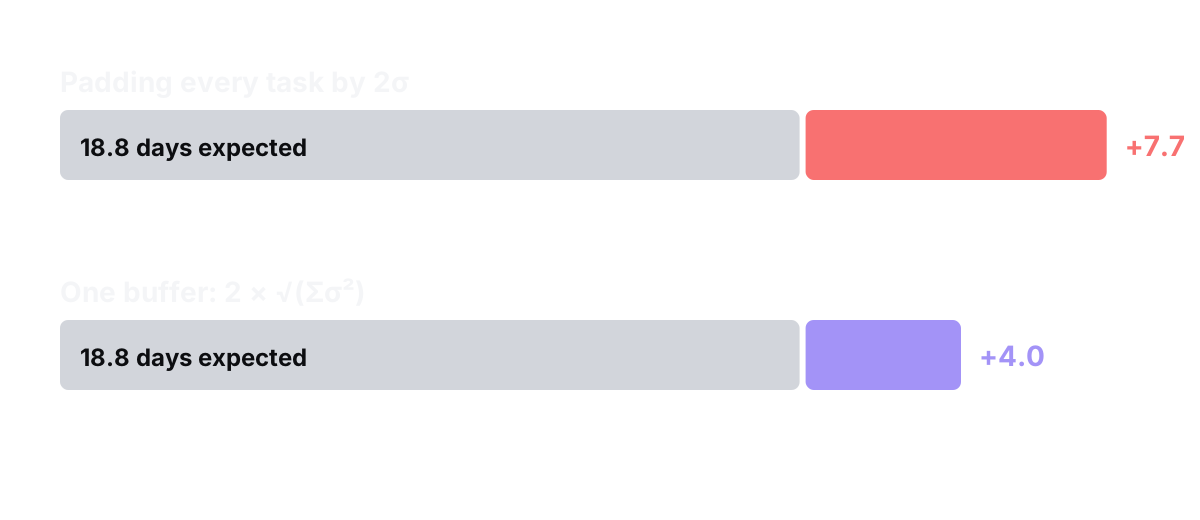
buffer = 2 × √(σ₁² + σ₂² + … + σₙ²)If the tasks run over independently, their overruns don’t all happen together, so the spreads add as squares rather than directly. Two standard deviations cover about 95% of outcomes if the total is roughly normal. That approximation is reasonable for a chain of many tasks and weak for two or three. If several tasks share a cause of delay, such as the same reviewer or the same unknown API, they aren’t independent, and the RSS buffer is too small.
3. Contingency reserve. A slider adds a percentage of the expected duration (15% by default, up to 50%) for things the estimates don’t cover: scope that grows, people who are away, suppliers who are late. There’s no formula for this number. The calculator keeps it separate so you can see how much of the total is judgement.
With the four example tasks the calculator loads with, the expected duration is 18.8 days, the RSS buffer adds 4.0 and a 15% contingency adds 2.8, for a total of 25.6 days. It also writes the result as Mermaid code, with the buffer as a final task in its own section.
Critical Chain’s 50% rule is a different method
Critical Chain Project Management (CCPM) is the method Eliyahu Goldratt described in his business novel Critical Chain (1997). It’s often mentioned next to RSS, and the two get mixed up. They share the idea of pooling margin, but they size it differently.
CCPM asks for estimates at about 50% confidence, with no padding in them. The safety taken out of each task is pooled into visible buffers: a project buffer at the end of the critical chain, and feeding buffers where a side branch joins it. It argues that padding each task fails for three reasons: Parkinson’s Law, the “student syndrome” (with more slack, people start later), and the fact that delays pass on to the next task while early finishes usually don’t.
The usual CCPM sizing rule is “cut and paste”: the project buffer is about half of the safety removed from the tasks. Since the estimates were roughly halved, the buffer ends up at about half the length of the chain. That rule grows in proportion to the chain. It doesn’t look at how uncertain each task is.
RSS starts from each task’s variance and grows with the square root of the sum of squares, so for long chains it gives a much smaller buffer. With our calculator’s arithmetic:
| Chain | Expected (Σ t_e) | RSS buffer | Half the chain |
|---|---|---|---|
| The calculator’s 4 example tasks | 18.8 days | 4.0 days | 9.4 days |
| 5 tasks, each O = 2, M = 4, P = 8 | 21.7 days | 4.5 days | 10.8 days |
| 20 tasks, each O = 2, M = 4, P = 8 | 86.7 days | 8.9 days | 43.3 days |
Neither number is “right”. The 50% rule is a rule of thumb that assumes the estimates were cut hard. RSS is only as good as your three-point estimates and the independence assumption. The calculator uses RSS; if you’d rather use the 50% rule, the buffer is half of the expected total.
And Andamio does neither. Its buffer is a number of days you type per task. That’s less clever, but you can always see where the buffer is and who it belongs to.
Where to start
If you have three estimates for each task on the chain, run them through the calculator to see how big the buffer should be. Then put the plan in Andamio, with review time as validation complexity and the calculated buffer as a final task before the deadline. How dates move along a chain of dependencies is covered in how to calculate the critical path, and how to show this plan to a client in using Gantt charts to set realistic expectations.