Where the rendering time goes in Globdrop and Andamio
An earlier version of this post described techniques we don’t use: row virtualisation, path simplification, CSS containment and a canvas loop. None of them is in the code of Globdrop or Andamio. This version describes what the two apps actually do when they draw, what we could count without a browser profiler, and which measurements we still need to take.
What we measured, and what we didn’t
We haven’t published browser profiles of either app. There are no DevTools traces, frame timings or Interaction to Next Paint figures in this post, because we haven’t recorded any we’d stand behind.
What we did measure is deterministic:
- The number of DOM elements Andamio’s Gantt view produces for a given plan. We rendered the real
InteractiveGanttcomponent with React’s server renderer (renderToStaticMarkup) and counted the tags. That’s the same element tree the browser builds, without timing anything. - How long Andamio’s scheduling function takes, run in Node 25 on an Apple M1 Max. That’s a pure function, so Node is a fair place to time it, but those times aren’t browser frame times.
Everything else here is read from the code.
Globdrop: nothing to paint
During a round, Globdrop’s screen is one <img> with the map, two pins (each a div with a small inline SVG), one SVG line for the distance, a score, a place name and a timer. The map’s vector detail is inside the image file. The Europe map has 2,841 <path> elements and the world map 2,172, but an SVG loaded through <img> isn’t part of the page’s DOM. There’s nothing to style, lay out or attach events to, path by path. The browser draws the file as a picture.
The work per frame is small. The countdown in src/engine/timer.ts runs on requestAnimationFrame and, on each frame, sets the timer’s text and one stroke-dashoffset on the ring. A click reads two bounding rectangles, runs one projection and one distance formula, and moves the pins. The pin drop and the distance line are CSS animations.
So Globdrop is quick for a simple reason: it doesn’t draw vectors itself. It hands the browser one image, and we pay for that in file size instead. The Europe SVG is 2.54 MB on disk and 553 KB over the wire. The cost we’d expect to matter is the first time the browser decodes and rasterises that file on a slow phone, and again when the window is resized. We haven’t measured it.
Andamio: everything, every time
Andamio is React 19. The Gantt chart is one component, src/components/InteractiveGantt.tsx, and it renders the whole plan on every render:
- The header and the grid. In day view, each day of the project gets a header cell (three elements) and a grid column (one element), so four elements per day. A 200-day plan has 800 elements before the first task.
- One block per task. Each bar is absolutely positioned (
top: rowIndex × 48px) and carries its three coloured segments (work, validation, buffer), two resize handles, four hover buttons with their icons, and a tooltip that’s always in the DOM and shown with CSS. We counted 48 elements per task: adding a 101st task to a 100-task plan adds exactly 48. - One path per dependency. The arrows are an SVG
<path>each, and to draw one the component finds the task it depends on withtasks.find(...), a linear search. With N tasks and D dependencies that’s about N × D comparisons per render.
For a chain of tasks where each one depends on the previous, with six days per task, the day view comes to:
| Tasks | Days on the chart | DOM elements |
|---|---|---|
| 10 | 65 | 759 |
| 50 | 305 | 3,679 |
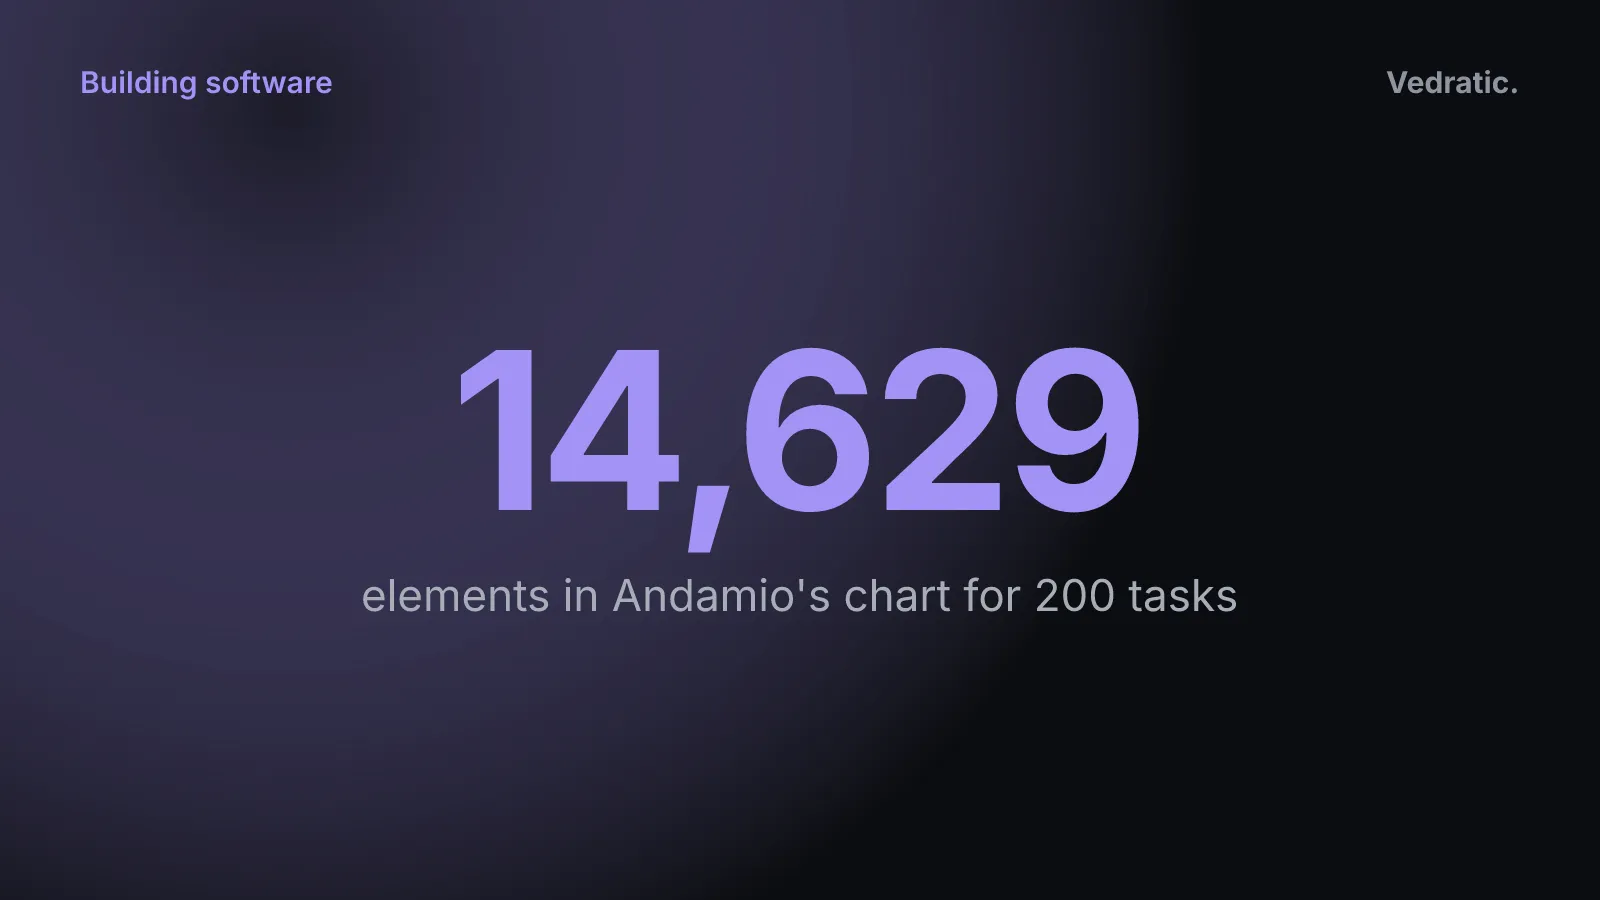
| 200 | 1,205 | 14,629 |
Nothing in the chart is memoised per row: there’s no React.memo, and the rows aren’t components of their own. Nothing is virtualised either, so rows off screen are rendered like the rest. The one memo is useMemo(() => calculateSchedule(project), [project]), which recomputes the dates only when the plan changes.
What a drag does
When you drag a bar, each mousemove calls setDragState with the new offset in days. That re-renders InteractiveGantt. The schedule isn’t recomputed, because project hasn’t changed, but React runs the whole render function again and compares the full tree: header, grid, every bar and every arrow. The browser then changes only a few elements: the dragged bar and the arrows attached to it. The cost we’d expect to grow with the plan is that comparison, which is proportional to tasks plus days, and it’s paid on every mouse event.
When you let go, the change is written to the project and a larger chain runs:
App.tsxre-renders. It callsgenerateMermaid(project)on every render, whichever view is open.- The left panel re-renders. It runs its own
calculateSchedule, and each task row in the tree looks up its children withallTasks.filter(...)and its dates withscheduledTasks.find(...). - The chart recomputes the schedule and renders again.
useProjectsserialises every project, not just the open one, withJSON.stringifyand writes it tolocalStorage. That’s a synchronous call.
Typing in a task’s name field in the left panel goes through the same four steps on every keystroke.
How long the scheduler takes
calculateSchedule repeats a pass over the tasks until nothing moves, up to 1,000 passes (how Andamio works has the details). How many passes it needs depends on the order of the list. If every task comes after the tasks it depends on, two passes are enough. If the list is in the opposite order, each pass pushes the dates forward by only one link of the chain.
| Chain of tasks | List order | Time per call |
|---|---|---|
| 1,000 | dependencies first | 0.22 ms |
| 1,000 | reversed | 46.7 ms |
The reversed case also shows a correctness limit. With 1,002 or more tasks in reversed order, the loop stops at its 1,000-pass cap before the dates settle. A chain of 1,100 tasks, six days each, should end on day 6,600, and it ends on day 6,006. A plan that long, listed backwards, is unusual, but the cap is silent: nothing tells you the dates didn’t settle.
What we think dominates, and what we’d measure
From the code alone, our expectation for a large plan is this: the scheduler is cheap in any normal order, and the time goes into React re-rendering the full chart on each mouse move, plus the full-app update (Mermaid text, left panel, JSON.stringify) on each edit. That’s a hypothesis. These are the measurements we’d take to test it, none of which we’ve published:
- A Performance panel recording of a bar drag on plans with 50 and 200 tasks, with 4× CPU throttling, to see scripting time per
mousemoveand whether frames are dropped. - React Profiler commit durations for the same drag, to split React’s work from the browser’s.
- Interaction to Next Paint while typing in a task name, for the same plans.
- For Globdrop, the decode and rasterisation time of the Europe and world SVGs on a mid-range Android phone, on first load and on resize.
What we’d change first
These aren’t in the code yet. If the profiles confirm the hypothesis, the first changes are small: make each bar a memoised component so a drag only re-renders the bar that moves, look tasks up in a Map by id instead of with find, compute the Mermaid text only when the Mermaid view is open, and delay the localStorage write until the user stops typing. Virtualising rows would come after that, and only if the profiles showed the element count itself was the problem.
For how Andamio’s data and views fit together, see how Andamio works. For Globdrop’s side, see how Globdrop is built and how we make a Globdrop map.