A 3D model of a place that you can orbit, with a timeline underneath that rebuilds it for any year. Today it covers three airports, Barcelona–El Prat and Palma de Mallorca from 1916 and Ibiza from 1936, up to the works planned for the 2030s. Every milestone and event links to where it comes from.
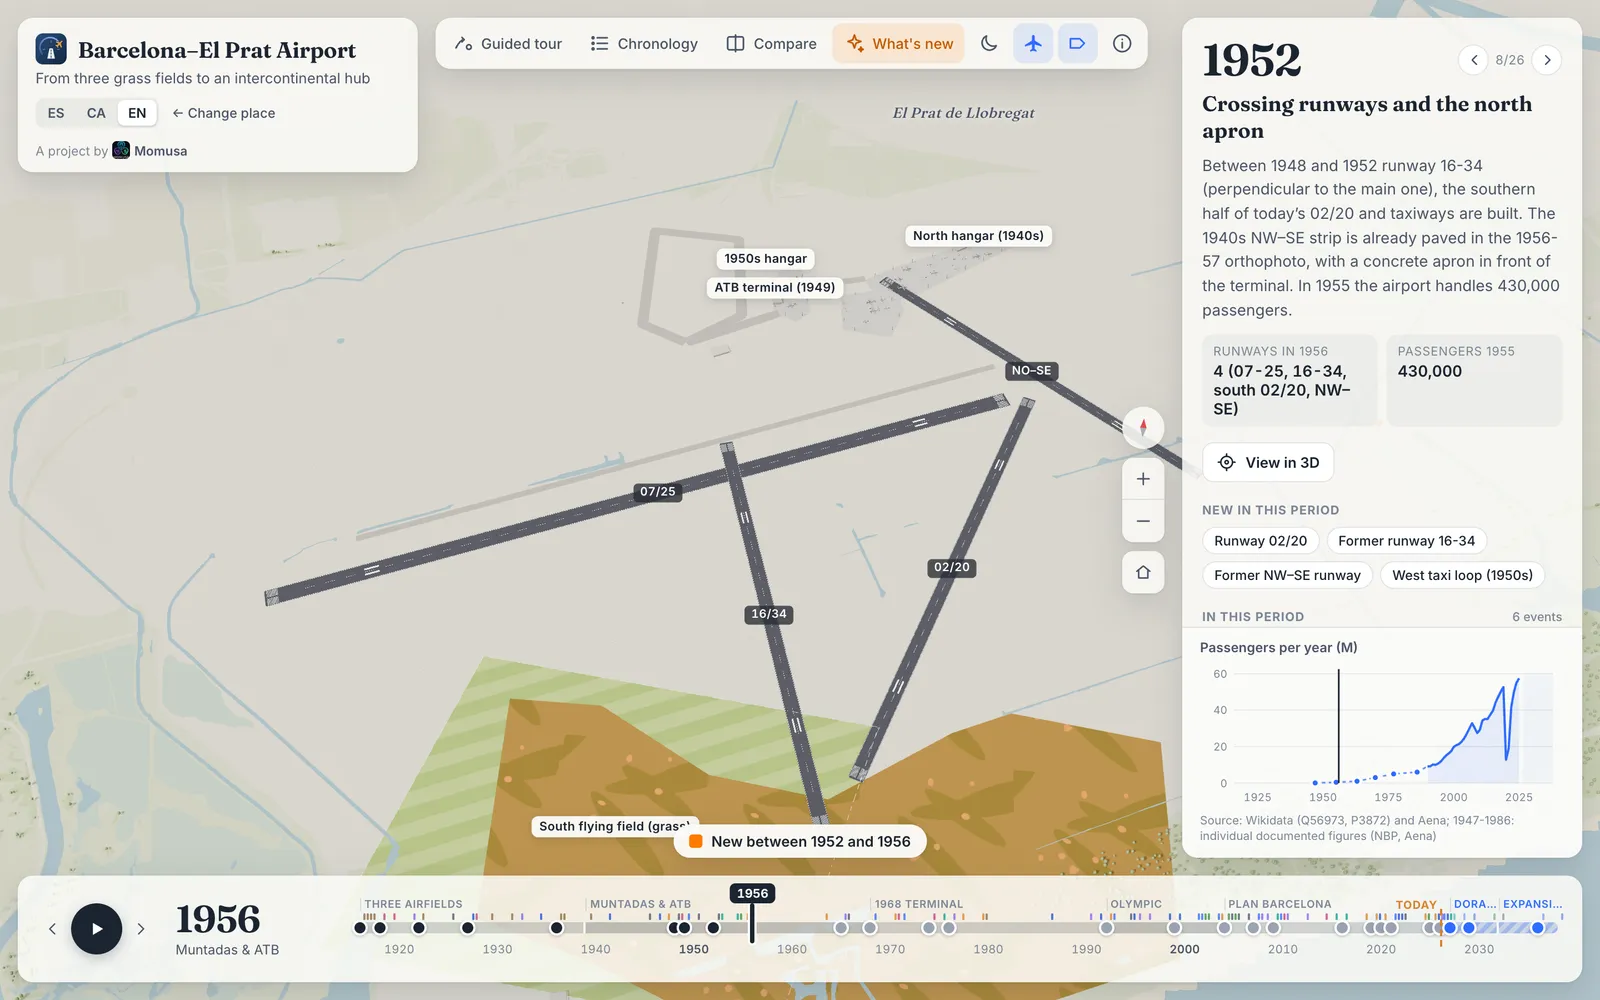
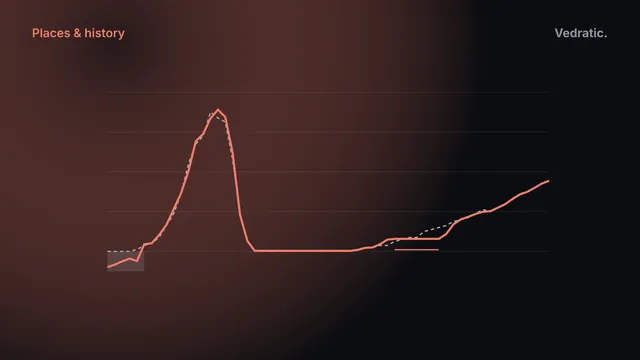
El Prat in 1956, with the story of the stage and the passengers per year.
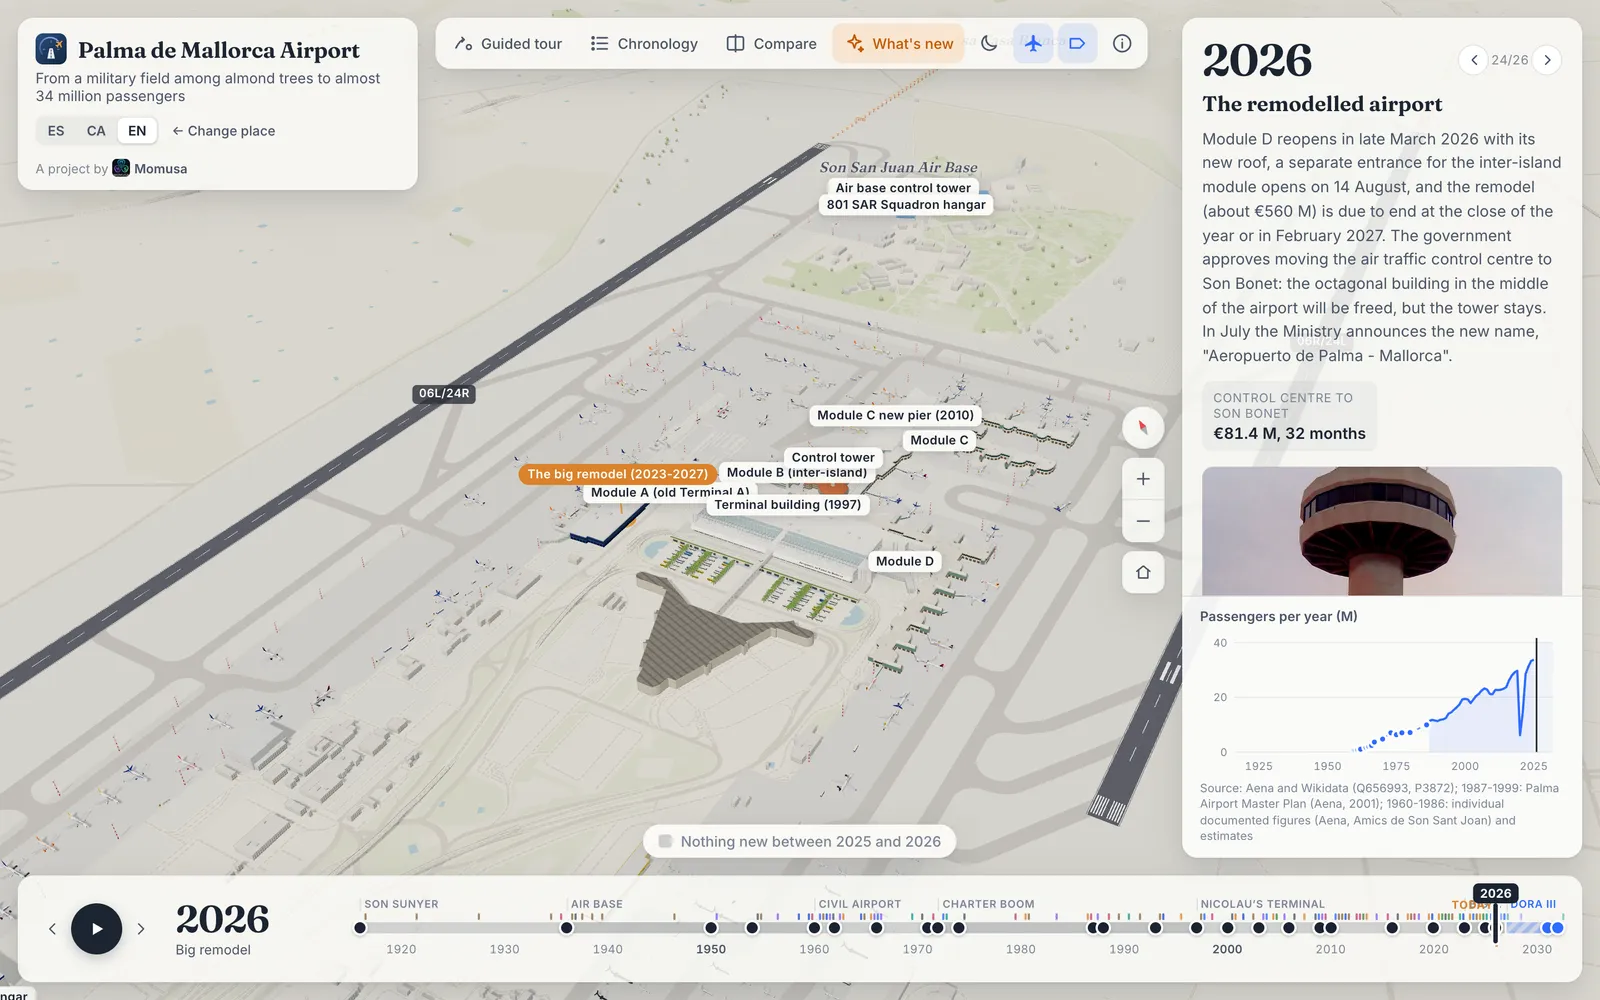
Palma in 2026, at the end of the terminal remodel.
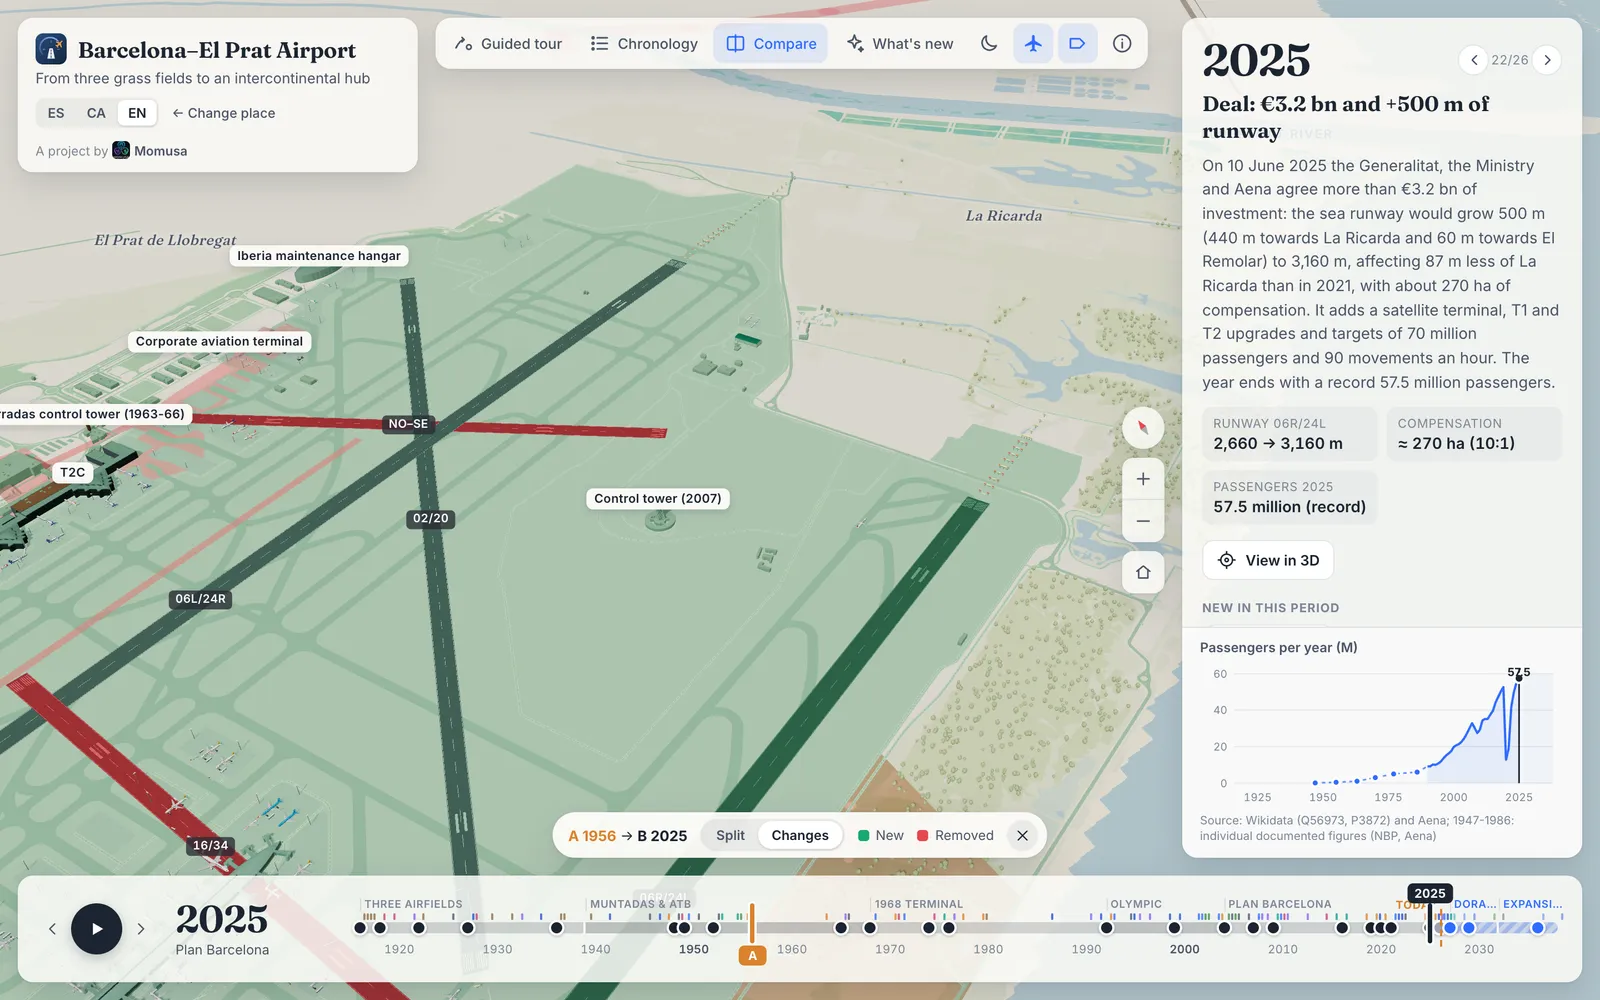
Changes between 1956 and 2025: new in green, removed in red.
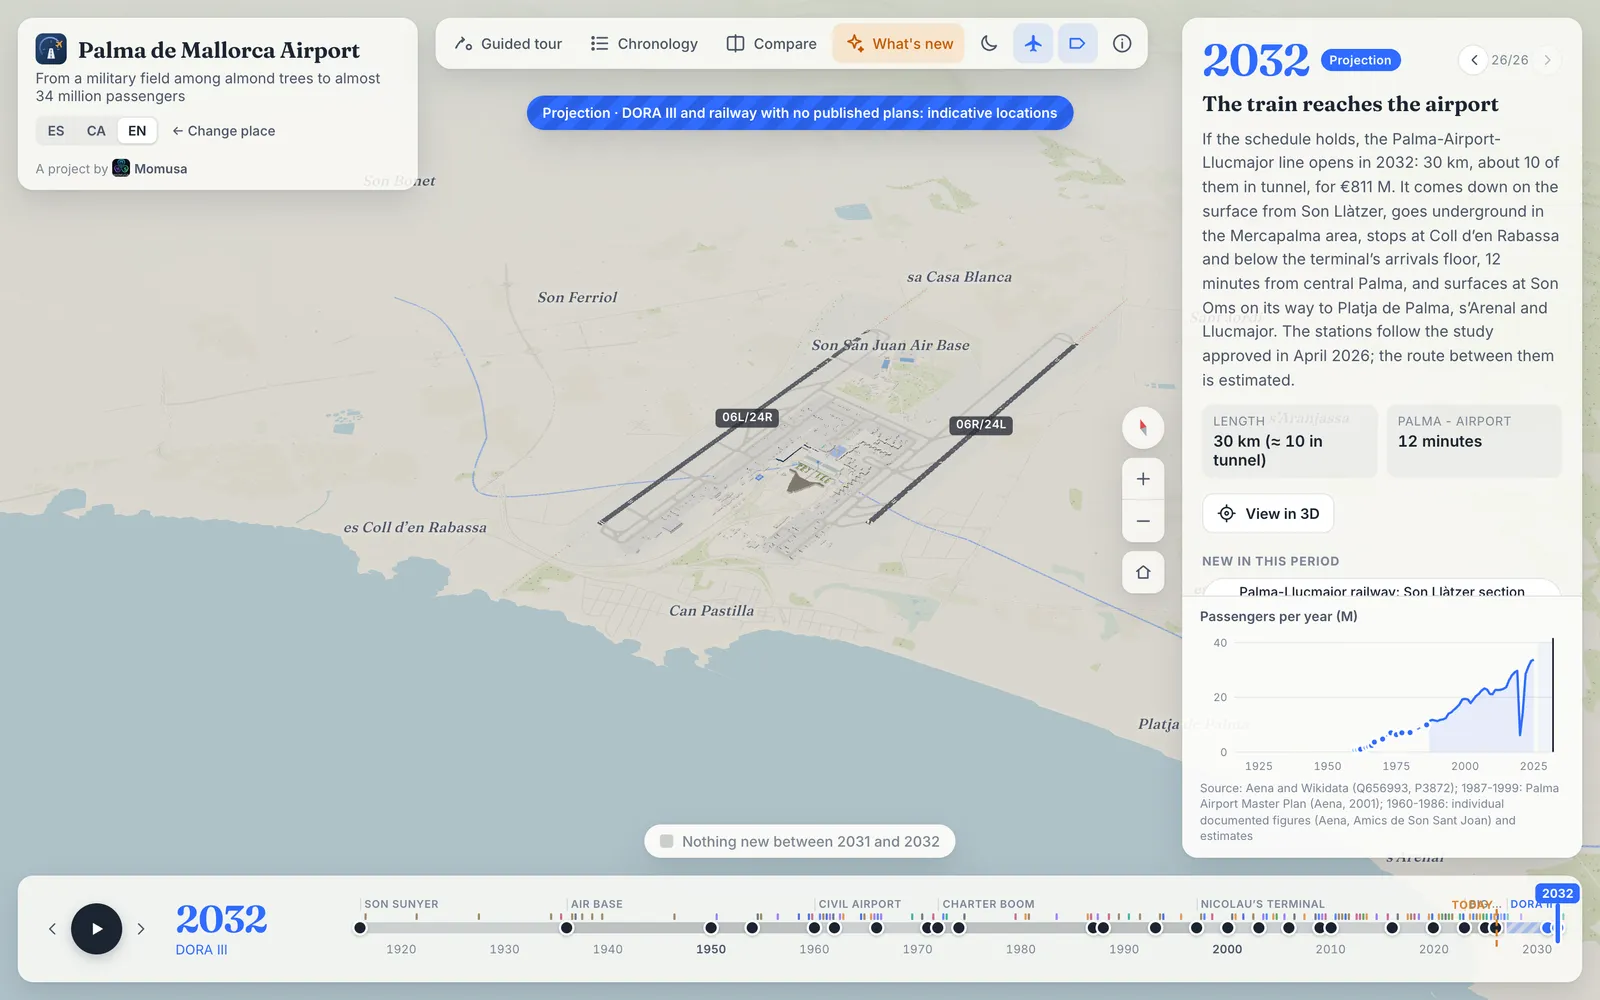
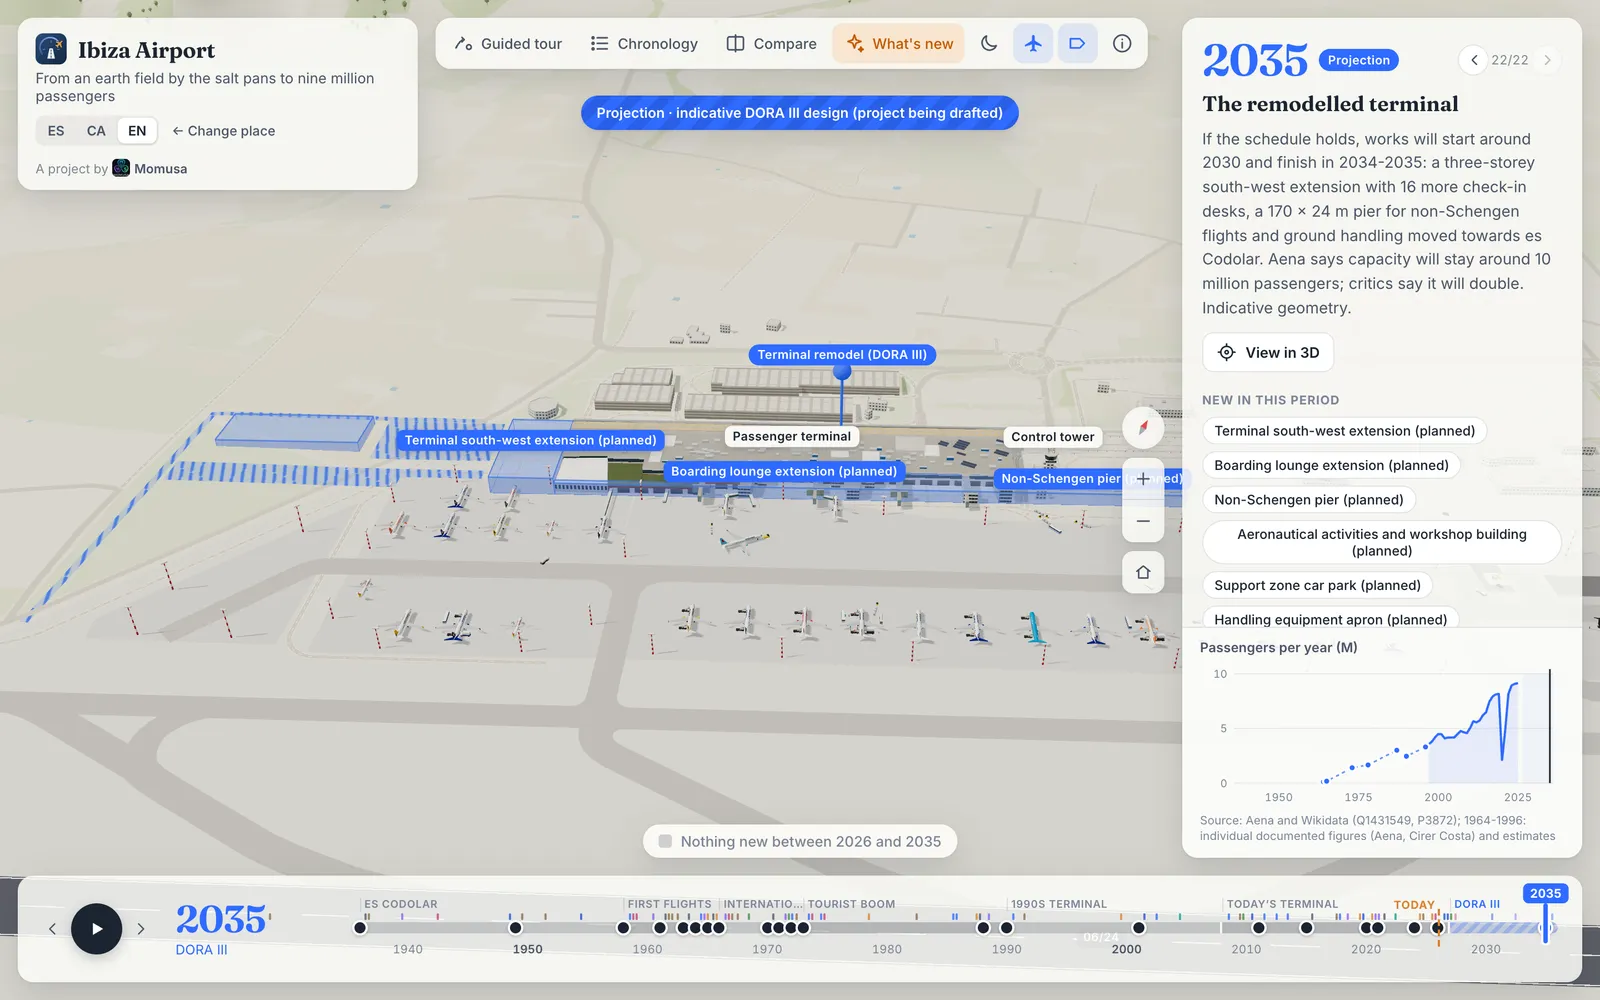
Planned works are drawn in blue, never as if they were built.
Ibiza's DORA III remodel, placed from Aena's apron plan.
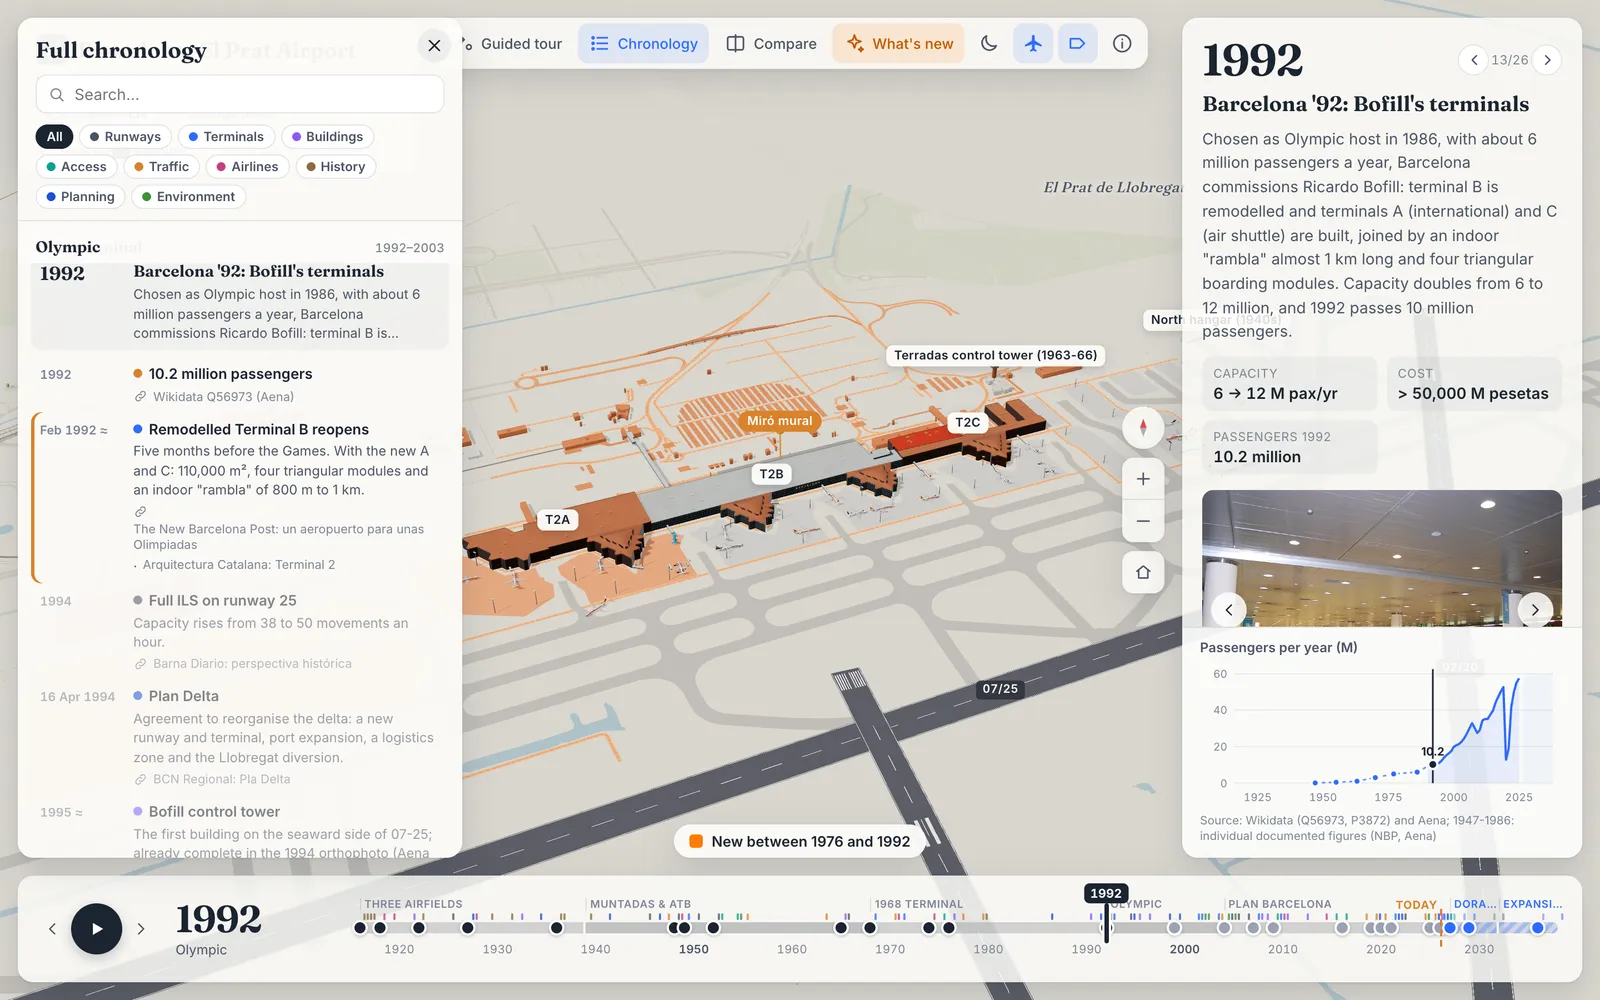
The chronology: every event, its date and its sources.
Why we built it
The history of a place is spread across photos, press cuttings, official gazettes and master plans, and it is hard to picture from any one of them where the 1949 terminal stood, how long the runway was in 1965, or what the 2030s works will change. We wanted to scrub through it instead: one model, every year, with the source for each stage one click away.
We started on 26 September 2026 with Barcelona–El Prat and added Ibiza the next day, which tested whether the same data model worked for a much smaller, seasonal airport. Palma de Mallorca followed on 3 October, and the same engine is now building the Sagrada Família. Chronotopia joins the Greek chronos, time, and topos, place, which is what the app shows: how a place changes over time.
3
Airports, from 1916 and 1936
74
Milestones, each with sources
308
Dated events
3
Languages
How it works
One model per place, rebuilt for whatever year the timeline is on.
A continuous timeline
Drag the year and the place changes under you: buildings rise out of the ground in the year before they open, demolished ones sink back, and runways grow towards their new ends. Play moves at about two seconds per year and slows down at each milestone.
The story of each stage
74 milestones, 26 at El Prat, 22 at Ibiza and 26 at Palma, each with its text, key figures and sources, many with photos from Wikimedia Commons, and a chart of passengers per year that follows the timeline.
Guided tours
Fifteen tours, seven at El Prat and four each at Ibiza and Palma, fly the camera and move the year for you, from the whole history in a few minutes to just the runways or just the terminals.
A searchable chronology
308 dated events across the three airports, grouped by era, with a search box and filters for runways, terminals, buildings, access, traffic, airlines, history, planning and environment. Each one opens its year.
Compare two years
Side by side, with a divider you can drag, or as a single view of the changes: what is new since the first year in green, what has gone in red.
Click anything
Buildings, runways and aprons open a card with their dates, figures, architect, photo and sources, and a badge when a date or a position is an estimate.
Aircraft of each era
The types and airlines of each period, in simplified liveries, landing, taxiing and parked, with fuel bowsers and catering trucks at the stands. 2025 runs at the real rate of landings; passengers walk, take a bus or a jet bridge depending on the year.
The real ground
The IGN's MDT25 terrain model under every airport, 34 km across, with the airport levelled and the sea meeting the mapped coastline. Day and night, with the apron floodlights and runway lights.
English, Spanish and Catalan
Every text, milestone and event in three languages. The page address keeps the place, the year and the language, so any view can be shared as a link.
Where the model comes from
Today's place, from OpenStreetMap
Terminals, aprons, taxiways, roads and buildings as they are now, fetched from OpenStreetMap and laid on the IGN's MDT25 terrain model.
The past, from aerial photos and texts
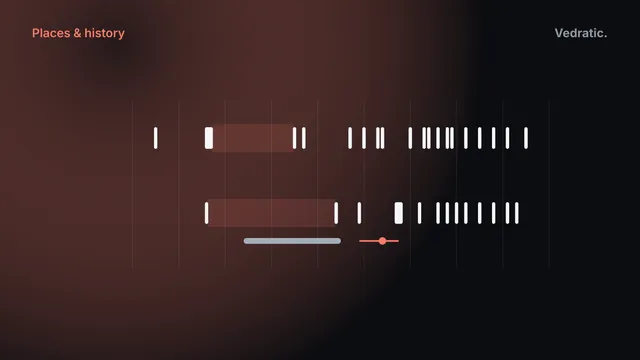
Each feature gets the year a source gives, or the midpoint between the last aerial photo without it and the first with it, or the date of its zone. Runways, old terminals and fields that no longer exist are drawn by hand from the photos.
The future, from what has been published
The approved expansion of El Prat, the DORA III remodel of Ibiza, and at Palma the DORA III investments and the Palma–Llucmajor railway, placed from the plans and documents that exist and drawn in blue as indicative. Where nothing has been published, the card says the place is assumed.
The Sources button in the app gives each place's method and its full list of sources, with the credit for every photo.
What we learned
The gaps between photos are the real resolution. A building that appears between two flights two years apart is dated to within a year. One that appears between 1957 and 1975 could be from any of those years, and the badge can't tell you which case you're looking at.
Photos and texts disagree more often than we expected. Ibiza's 1990s terminal is in the photos and in no text we found; its 1964 terminal was in the wrong place until the photos and an encyclopaedia entry were read together. The model notes each disagreement in the feature's card instead of hiding it.
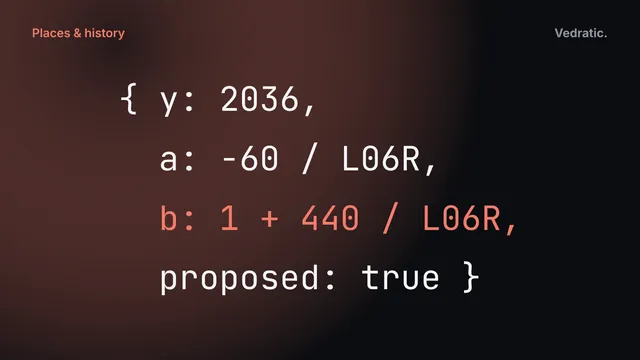
A runway is simpler than it looks. One centreline and a list of dated extents, as fractions along it, is enough to grow it, rename it and hatch a planned extension at both ends.
An airport under works is the hardest year to draw. Palma was half-remodelled when we modelled it: a module closed for a new roof, a wing open, another still a building site. Each piece needs its own dates, and one OpenStreetMap outline can hold pieces with different lives.
Limitations
What Chronotopia doesn't do, so you can decide before you start.
Only airports so far: Barcelona–El Prat, Ibiza and Palma de Mallorca. The Sagrada Família appears in the picker as coming soon: we are building it, and it can't be opened yet.
Most dates are estimates. Only 64 of the 2,437 dated features at El Prat have a year a source gives, 28 of 753 at Ibiza and 25 of 2,659 at Palma; the rest are dated from aerial photos or by zone, and marked with ≈.
Most shapes are today's. The present-day geometry comes from OpenStreetMap and is dated backwards; only 91 features at El Prat, 46 at Ibiza and 62 at Palma are drawn by hand.
The aerial photos have gaps: none of El Prat between 1957 and 1975, and none of Ibiza or Palma between 1956 and 1984. Those years rest on written sources.
The aircraft are not real flights. The mix of types and airlines comes from a table with estimated shares, and years before 2025 are shown busier than they were.
Planned works are indicative. No master plan is finished, and at Palma neither DORA III nor the railway has published plans, so their places are assumed.
It needs WebGL. Phones get a lighter version with fewer aircraft, fewer trees and a coarser terrain.
Frequently Asked Questions
Is Chronotopia free?
Yes. There are no accounts, no analytics and no ad network. Inside the app there are links to Momusa and Sindria, the companies behind Vedratic, and a short note about one of them at most once a day; to space those notes out it keeps two values in your browser's local storage. It loads its fonts from Google Fonts and the historical photos from Wikimedia Commons.
Why is it called Chronotopia?
From the Greek chronos, time, and topos, place: it shows how a place changes over time. It started with airports, and the same engine is now building its first monument, the Sagrada Família, which isn't open yet.
Which places can I explore?
Three airports: Barcelona–El Prat, on a timeline from 1916 to 2038, Ibiza, from 1936 to 2036, and Palma de Mallorca, from 1916 to 2032. The years after today show the works that are planned. The Sagrada Família appears in the picker as coming soon: we are building it, and it can't be opened yet.
Where do the dates and figures come from?
Every milestone and event links to its sources: Aena, the official gazette (BOE), municipal archives, the Enciclopèdia d'Eivissa i Formentera, ENAIRE's aeronautical publication, architecture journals and the press. The shapes of the old runways, aprons and terminals were traced from historical orthophotos (ICGC for El Prat, IDEIB and the IGN for Ibiza and Palma). The Sources button in the app opens the method and the full list, with every photo credit.
Why do so many buildings say "≈ Approximate date or position"?
Because no document dates them. Only a few dozen named features at each airport, such as T1, Palma's 1997 terminal or the runways, have a year a source gives. The rest are dated from the aerial photos, as the midpoint between the last flight without them and the first flight with them, or by the zone they are in. Ibiza and Palma have no aerial photo between 1956 and 1984, so everything built in those years is dated from texts.
Are the future works what will actually be built?
Not necessarily. They follow what has been published: the approved expansion at El Prat, the DORA III terminal remodel at Ibiza, and at Palma the DORA III investment plan and the Palma–Llucmajor railway, neither of which has published plans yet. From the year after today a banner says the design is indicative, and planned buildings are drawn in translucent blue, planned aprons, runway extensions and railways hatched.
Are the aircraft real flights?
No. Each airport has a table of the aircraft types and airlines that flew there in each period, with an estimated share of the flights, and the app draws from it. 2025 is shown at the real rate of landings; earlier years are shown busier than they were, so there is always something moving. The same year always shows the same aircraft.
Does it work on a phone?
Yes, with a lighter version: no shadows, fewer trees, fewer moving aircraft and a coarser terrain. Like any 3D page, it needs a browser with WebGL.
Can I link to a particular year?
Yes. The page address keeps the place, the year and the language, for example chronotopia.vedratic.com/?site=palma&year=1974&lang=en. Add &news=0 to turn off the orange "What's new" highlight.
I found a mistake. How do I report it?
Use the contact form and tell us the place, the year and what looks wrong. A source helps most: a dated photo, an orthophoto or a document. Each building's card in the app says what its date is based on.
How Chronotopia stores a runway's whole history as one centreline with dated phases, grows it smoothly between them, and hatches the part that is only planned.
How Chronotopia gives a year to thousands of buildings, aprons and taxiways that no document dates: aerial photos, the gaps between them, and what ≈ really means.
How Chronotopia turns Spain's 25 m terrain model into ground under El Prat and Ibiza: a levelled platform, a coast that meets the map, and buildings standing on it.
Chronotopia rebuilds Barcelona–El Prat from 1916 and Ibiza from 1936 in 3D, one year at a time, with a source behind every event. What it shows and what it can't.