How we make a Globdrop map: one image, a bounding box and a projection
This post used to be a general guide to drawing SVG maps from GeoJSON with D3. Globdrop doesn’t work that way, and none of that code was ever in it. Here is what we actually do to add a map to the game, from the image file to a click turning into a coordinate.
Step 1: an image of the map
Every Globdrop map starts as a single image file in public/maps/. Some are SVG, some are raster. What we can say about where each came from is limited to what the files and the repo history record:
- World (
world.svg, used by five scenarios): the file’s metadata names itWorld_map_(Miller_cylindrical_projection,_blank).svgand marks it public domain. The name tells you the projection, and that’s why the world scenarios use Miller. - United States (
us.svg): the header comment credits Simplemaps.com (2017), with a licence note saying it is free for commercial use. - Mediterranean (
mediterranean.svg, for the ancient wonders): an Inkscape file whose name isBlank Map of Mediterranean Sea region.svg. - Europe (
europa.svg): an Inkscape file with no licence or source in its metadata. We haven’t recorded where it came from. - Catalonia: inherited from the older game Globdrop grew out of, together with its bounding box in UTM metres.
- Middle-earth, Westeros and One Piece: raster images with no source recorded in the repo.
Some maps were changed after import. scripts/color_maps.cjs gives each state or country in us.svg and world.svg a fill colour and adds a sea gradient, and the Europe map was recoloured by a set of one-off Python scripts that were removed from the repo on 7 June 2026. Middle-earth was replaced: a 6.6 MB JPEG was removed from the repo on 15 May 2026, and the image in use is 1.09 MB.
What the vector maps have in common is what they leave out: they’re “blank” maps, with shapes and no place names. An early design document in the repo (docs/iPlace_Evolution_Spec.md) records the reason for using static images instead of a tile engine: labels would give answers away, and the game needs neither zoom nor data layers.
Step 2: a scenario file
A map becomes playable when a JSON file in public/data/scenarios/ points to it. The fields that matter for geometry are the coordinate system, the bounding box, the unit and mapRealWidth. For Europe:
"coordinateSystem": "LAEA",
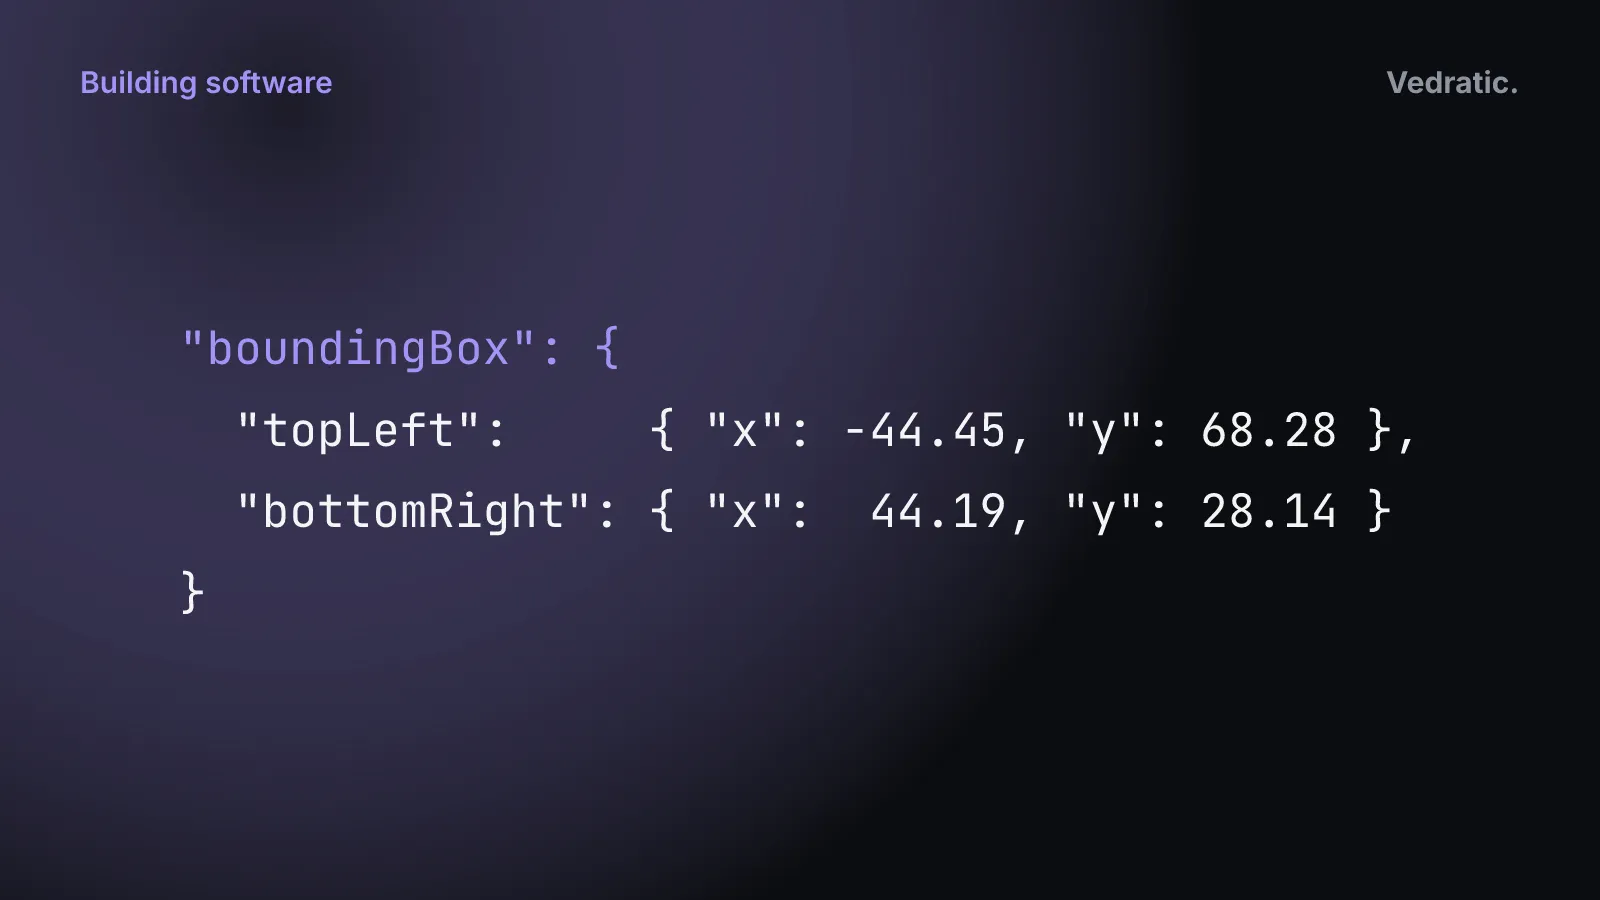
"boundingBox": {
  "topLeft": { "x": -44.4476, "y": 68.2821 },
  "bottomRight": { "x": 44.1896, "y": 28.1426 }
},
"distanceUnit": "km",
"mapRealWidth": 4500,
"maxDistance": 500
The bounding box is the longitude and latitude of the image’s top-left and bottom-right corners, in the scenario’s own system. For Catalonia they are UTM metres, and for the fictional maps they’re arbitrary units. Getting those four numbers right is the hard part, and it’s what the calibrator is for. What the other fields do to the score is covered in Calibrating a map image.
Step 3: calibrating with tools/calibrate.html
The calibrator is a single HTML page with its own script, tools/calibrate.js. It reads the scenario files from the game’s /data/ folder, so it’s meant to run next to the game, not on its own. It was added on 15 May 2026, in the same commit as the world, US and Westeros maps, and on 7 June 2026 it moved out of public/ into tools/, so it’s no longer deployed with the game. You load a scenario and it draws every place as a draggable pin on top of the image, using the same projection maths as the game. The script’s comment says the maths is duplicated from coordinate-math.ts so the page can run on its own.
It gives you three ways to fix a map:
- Reference points. Click a spot on the image and tie it to a place whose real coordinates you know. With two or more, “Calculate BBox” fits the image to them. For each axis it projects the reference coordinates, fits a straight line from pixels to projected values by least squares, reads that line at the image’s edges, and projects the two corners back to latitude and longitude.
- Nudge and scale. Buttons shift the box left, right, up and down, or grow and shrink it around its centre.
- Drag a pin. Moving a place’s pin rewrites its coordinates from the new pixel position. On the fictional maps there are no real coordinates to start from, so the pin’s position on the image is the coordinate.
“Validate” lists every place with its pixel position and flags the ones that fall outside the image. “Export All” copies the whole scenario JSON to the clipboard and downloads it as a file.
One gap we know about: when you drag a pin, the calibrator converts the pixel with projection maths for Mercator, Miller and the linear systems only. On the Europe and US maps it interpolates latitude and longitude in a straight line, so a pin dragged there gets slightly wrong coordinates. Reference points and the bounding box do use the right projections.
Step 4: from a click to a coordinate
In the game, the map is an <img> with object-fit: contain. The code first works out where the picture actually sits inside the element, then subtracts that offset from the click. The result is a pixel position relative to the image as drawn, together with the drawn width and height. pixelToCoord in src/engine/coordinate-math.ts does the rest. For the linear systems it’s plain interpolation:
// Linear
const rangeY = bottomRight.y - topLeft.y;
const y = (pixel.py / height) * rangeY + topLeft.y;
return { x, y };
For the projected systems, the same interpolation happens in projected space: the two corners are projected, the pixel is placed between them, and the result is projected back. Because the code works with the drawn size and not the file’s, the same numbers work on a phone and on a 4K monitor. The formulas for each projection are in Six coordinate systems in one geography game.
Why one image and not paths
The usual ways of putting a map on a web page trade different things. This is how they compare for a game like ours, where the map is a backdrop you click on, not a document you explore:
| Raster tiles | SVG paths in the DOM | Canvas or WebGL | One calibrated image (Globdrop) | |
|---|---|---|---|---|
| What the browser gets | Many small images, loaded per zoom level | One element per shape | Geometry drawn by your own code | One file |
| Zoom | Built in, but blurry until the next level loads | Sharp at any size | Sharp, if you redraw | Only what the file allows; the game has none |
| Styling | Baked into the pixels | CSS, per shape | In your drawing code | Baked in when the file is made |
| Click on a shape | Needs a separate data layer | Events per element | Hit-testing by hand | Not needed: we want the coordinate, not the shape |
| DOM cost | Tile elements | Grows with the number of shapes | One element | One element |
| Fits Globdrop? | Brings in labels and a map engine | Thousands of elements for Europe | Code we’d have to write and test | Yes |
The last row is the whole argument. A player never clicks a country, only a point on the map, so we don’t need to know which shape is under the cursor. We need a bounding box and a projection, and those fit in a few lines of JSON. The browser shows the image, and none of the Europe map’s 2,841 paths becomes part of the page.
What it costs is file size and flexibility. The Europe SVG is 2.54 MB on disk, and a map can’t be restyled from CSS, which is why the colours were written into the world and US files by a script. And without zoom, the smallest targets are hard to hit on a phone: Catalonia has 946 municipalities on an image 1,200 pixels wide.
How it all runs together is in how Globdrop is built, and a map made without real coordinates at all is in Making a playable fictional map. To see the result, play a round.