The Role of Vector Maps in Modern Web Applications
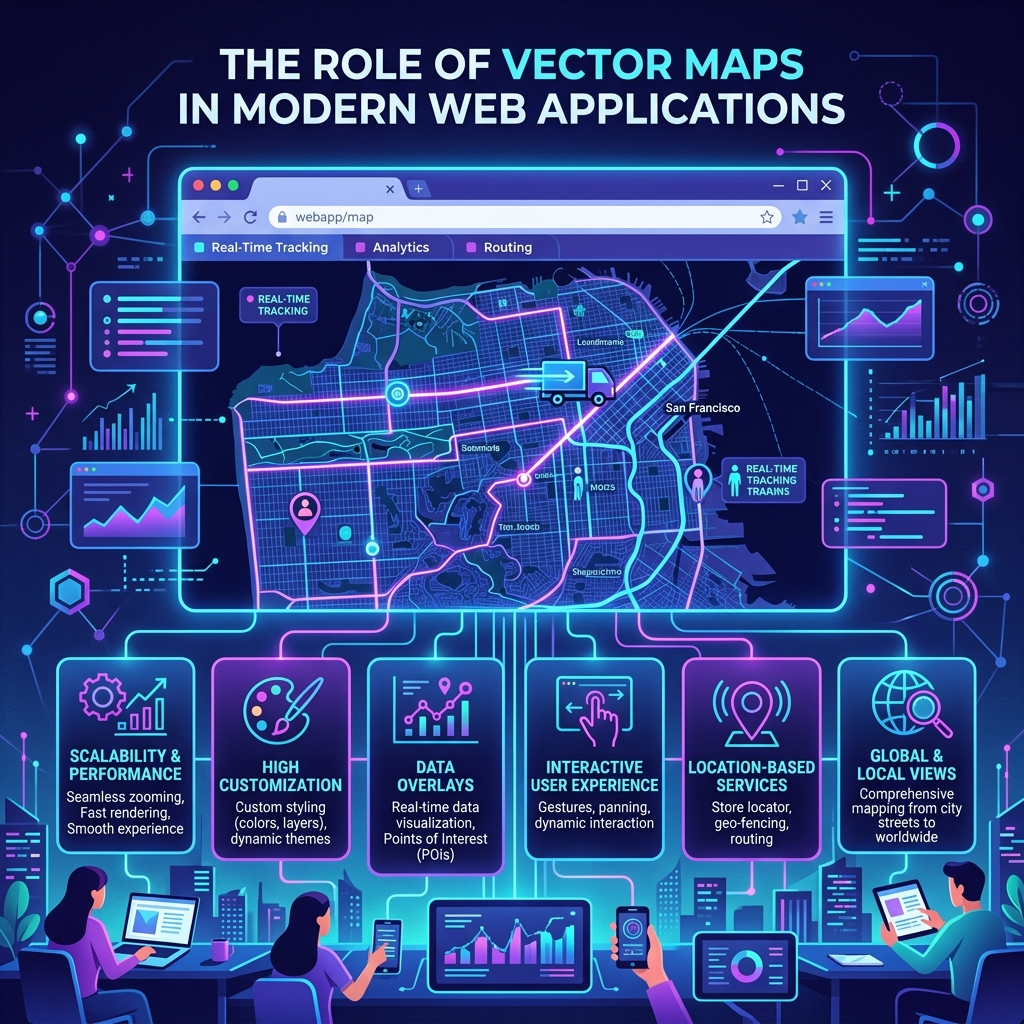
For the first two decades of the commercial web, mapping applications were dominated by a single technology: raster map tiles. If you used Google Maps or MapQuest in the late 2000s, you were downloading hundreds of tiny, pre-rendered PNG or JPEG images (usually 256x256 pixels) that the browser stitched together into a continuous grid. Today, this paradigm has shifted entirely. Modern web applications—from complex data visualization dashboards to lightweight browser games like Globdrop—rely almost exclusively on vector maps.
This transition from raster imagery to scalable vector graphics (SVG) and WebGL-rendered vectors represents one of the most significant performance leaps in frontend engineering. Here is a technical breakdown of why vector maps have taken over.
The Limitations of Raster Tiles
A raster image is essentially a grid of colored pixels. This simplicity comes with severe drawbacks for dynamic web applications:
- Resolution Dependence: If you zoom in on a raster tile before the browser downloads the next zoom-level tile, the image becomes blurry and pixelated. Supporting high-density "Retina" displays requires serving massive image files.
- Inflexible Styling: Because the text, borders, and terrain are baked into the image pixels on the server, you cannot change the map's style (e.g., switching to dark mode) without downloading an entirely new set of tiles.
- Network Overhead: Fetching dozens of individual image requests places a massive burden on the network, leading to the familiar "gray squares" loading effect on slow connections.

The Vector Revolution
Instead of sending pre-drawn pictures, vector maps send the mathematical instructions required to draw the map. A server transmits data (typically in GeoJSON or protocol buffer formats) containing the coordinates of rivers, the polygons of country borders, and the locations of cities. The client's browser then uses the CPU or GPU to draw these shapes in real time.
Infinite Scalability
The most immediate benefit of vector graphics is resolution independence. Because an SVG path is a mathematical curve, you can zoom in infinitely, and the borders will remain perfectly crisp. A single vector path for the coastline of Italy looks just as sharp on a 4K monitor as it does on a cheap mobile screen, without requiring multiple file versions.
Dynamic Client-Side Styling
Since the map data (the geometry) is separated from the presentation layer, developers can manipulate the map dynamically using CSS or JavaScript. You can change the color of a country when a user hovers over it, instantly switch the entire map to a high-contrast dark theme, or hide political borders—all without making a single network request.
Interactivity and Event Handling
In a raster map, if a user clicks on "France," the application has to do complex geographic math to figure out what pixel corresponds to what coordinate. In an SVG map, "France" is literally an HTML DOM element (<path id="FR">). You can attach native JavaScript event listeners directly to it:
// Native DOM interaction with SVG maps
document.getElementById('FR').addEventListener('click', (e) => {
e.target.style.fill = '#3b82f6'; // Instantly turn France blue
showDataPanel('France');
});
Performance Considerations: SVG vs Canvas/WebGL
While vector maps are generally superior, developers must choose the right rendering technology based on the application's complexity.
SVG (Scalable Vector Graphics) is perfect for stylized maps, data visualizations (often powered by libraries like D3.js), and games like Globdrop. Because SVG elements are part of the DOM, they are easy to style with CSS and accessible to screen readers. However, if you try to render hundreds of thousands of complex paths (like every street in New York City), the DOM becomes bloated, and the browser's paint performance will drop significantly.
For highly complex, street-level mapping, modern providers (like Mapbox GL JS or Google Maps v3) use WebGL via the <canvas> element. WebGL bypasses the DOM entirely, sending the vector data directly to the device's GPU for rendering. This allows for silky-smooth 60fps panning and 3D terrain manipulation, though it sacrifices the easy CSS styling of SVG.
Building Globdrop with Vanilla SVG
When engineering Vedratic's geography game, Globdrop, we opted for pure SVG vectors over WebGL. We don't need street-level detail; we need crisp national and regional borders that load instantly. By aggressively simplifying our GeoJSON data using algorithms like Douglas-Peucker (which removes unnecessary points from polygon edges), we compress entire continent maps into SVG files smaller than 50KB.
This lightweight approach ensures that Globdrop boots up in under a second on mobile networks, and the native SVG elements allow us to animate coordinate arrows and scoring feedback using hardware-accelerated CSS transforms.
Conclusion
Vector mapping has transformed cartography from a static image-serving problem into a dynamic, interactive rendering challenge. By shifting the drawing burden from the server to the client device, modern web maps provide sharper visuals, deeper interactivity, and a level of customization that raster tiles could never achieve.