How Climate Change is Redrawing the World Map
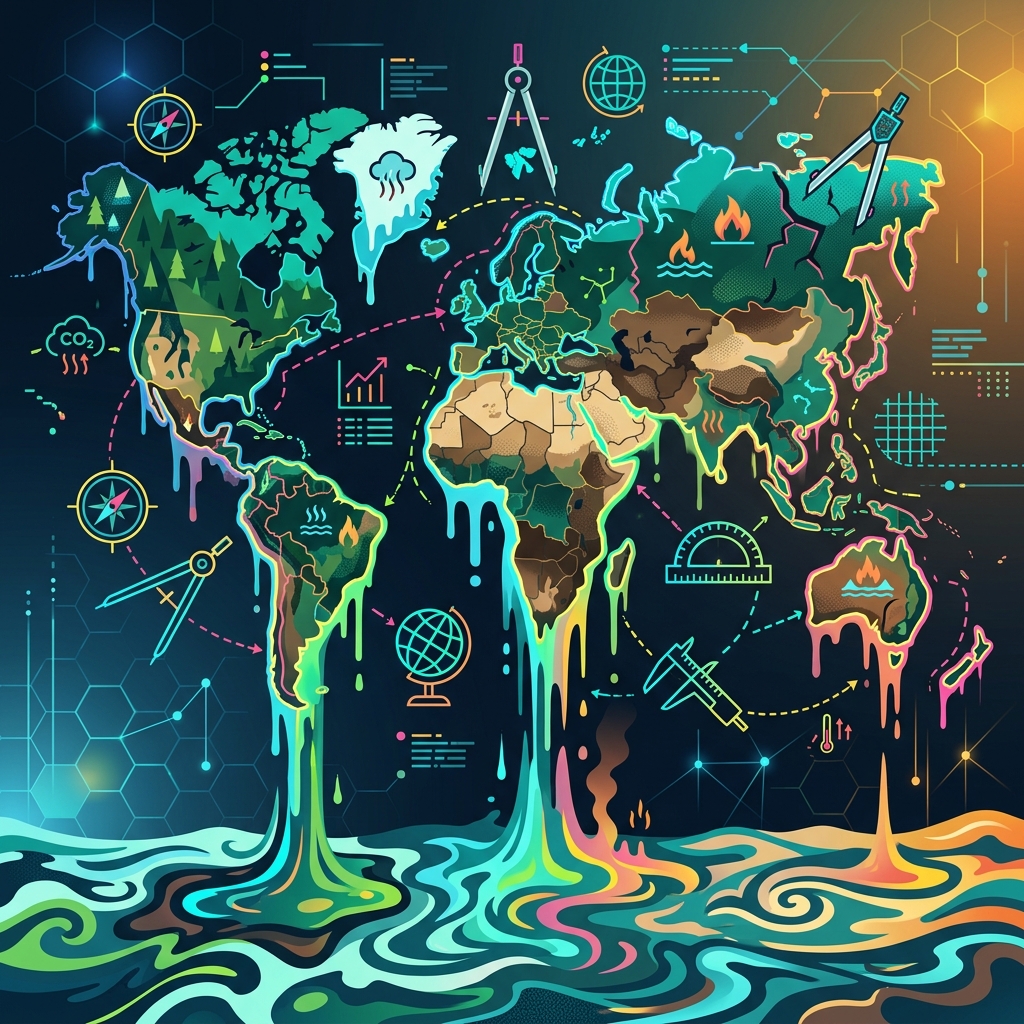
For most of human history, cartography was considered a relatively stable science. Once a continent was surveyed and a coastline mapped, the physical geography was presumed to be permanent—at least on human timescales. Political borders might shift with wars and treaties, but the mountains, rivers, and oceans remained steadfast.
Today, cartographers are facing an unprecedented challenge: the physical geography of the Earth is changing at a rapid, visible pace. Climate change is no longer just an atmospheric or ecological issue; it is a cartographic one. We are literally having to redraw the map of the world.
The Disappearing Coastlines
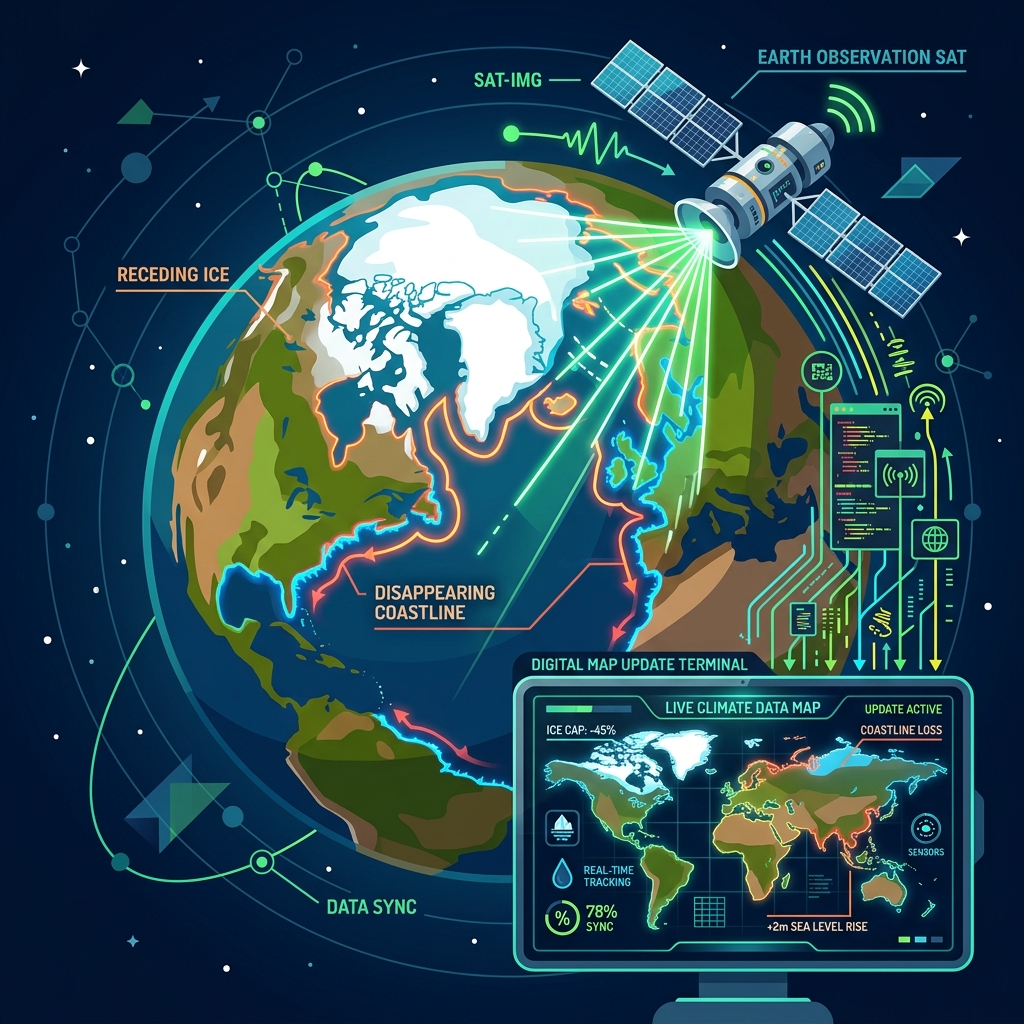
The most immediate and visible cartographic shift is happening at the edges of the continents. As global temperatures rise, thermal expansion of the oceans and the melting of land-based ice sheets (primarily in Greenland and Antarctica) are driving sea levels upward.
In low-lying regions, the map is changing year by year. In Louisiana, the US Geological Survey has had to remove over 30 named islands and coastal features from their official maps because they have simply vanished beneath the Gulf of Mexico. Archipelagic nations like Tuvalu, the Maldives, and the Marshall Islands are facing existential threats; current projections suggest their landmasses may be largely uninhabitable—and un-mappable as dry land—by the end of the century.
The Retreating Ice
Perhaps the most dramatic revisions to the world map are happening in the polar regions. For decades, standard world maps depicted the Arctic Ocean covered by a massive, solid expanse of permanent sea ice.
Modern satellite cartography reveals a very different picture. The permanent summer ice extent in the Arctic has shrunk by nearly 40% since satellite measurements began in the late 1970s. Cartographers now have to distinguish between permanent ice, seasonal ice, and open water. This isn't just an academic exercise; as the ice melts, new, previously unnavigable shipping routes (like the Northwest Passage) are opening up, radically altering global trade maps and sparking geopolitical territorial disputes over the Arctic seafloor.
Glaciers and the Loss of "Permanent" Snow
Inland, the story is similar. Topographical maps have traditionally marked glaciers and permanent snowfields in bright white or pale blue. Today, mapmakers are having to erase these features.
In Glacier National Park in Montana, only 25 active glaciers remain of the 150 that existed in 1850. In Iceland, geologists recently held a "funeral" for Okjökull, the first Icelandic glacier to lose its status as a glacier. When a map is updated to reflect these losses, it removes vital sources of fresh water that billions of people downstream rely upon, forcing governments to redraw maps of agricultural viability and water rights.
Shifting Biomes and the Expansion of Deserts
Maps don't just show land and water; thematic maps show biomes, vegetation, and climate zones. These zones are actively marching toward the poles. The Sahara Desert has expanded by about 10% over the last century, creeping southward into the Sahel region. Cartographers mapping the permafrost line in Siberia and Canada are having to adjust their boundaries hundreds of miles northward.
The Digital Advantage
If we were still relying exclusively on printed paper maps, keeping up with these changes would be impossible. Fortunately, the digital revolution in GIS (Geographic Information Systems) and satellite imaging allows cartographers to update maps in near real-time.
However, this creates a new psychological phenomenon for the public. When we look at historical maps, the differences are usually due to human error in the past—we found a new island, or we realized California wasn't an island. Today, when we look at a map from 2000 and compare it to a map from 2026, the differences aren't corrections of errors; they are records of physical loss.
Conclusion
Maps are not static documents; they are snapshots of the Earth at a specific moment in time. The rapid redrawing of coastlines, ice caps, and deserts serves as the most undeniable, visual proof of climate change. For cartographers, the job is no longer just about exploring the unknown; it is about documenting the disappearance of the known.