Why Visual Gantt Charts Beat Flat Task Lists
Every team manages work. Whether you're a solo developer building a side project or a product manager coordinating a cross-functional launch, you need a system to track what needs to happen, when, and by whom. The default choice for most teams is the humble task list — a flat, vertical inventory of to-do items, often managed in tools like Notion, Todoist, or even a plain text file.
Task lists are simple, familiar, and require almost zero learning curve. But as projects grow beyond a handful of items, their simplicity becomes a liability. They hide critical information: temporal relationships between tasks, resource conflicts, schedule risks, and the overall shape of the project. This is where Gantt charts — and specifically, lightweight browser-based tools like Vedratic Project Manager — offer a fundamentally better mental model for planning.
The Limits of Linear Thinking
A flat task list presents work as a queue: item after item, checkbox after checkbox. This structure implicitly suggests that tasks are independent and sequential. In reality, most project work is parallel and interdependent. Your designer can work on the UI mockups while your backend engineer sets up the API. Your QA lead can write test plans while both teams are still building. A task list cannot express this parallelism — it forces you to read between the lines.
Consider a typical software sprint with 20 tasks across 4 team members. In a flat list, you see 20 checkboxes. You don't see:
- Which tasks can run simultaneously — parallelism that could shorten your timeline by weeks.
- Which tasks block others — a single delayed dependency can cascade through your entire plan.
- Who is overloaded — one person might have 12 tasks while another has 3, but the list doesn't show this.
- Where the slack is — tasks with flexible deadlines that could absorb delays without affecting the final delivery.
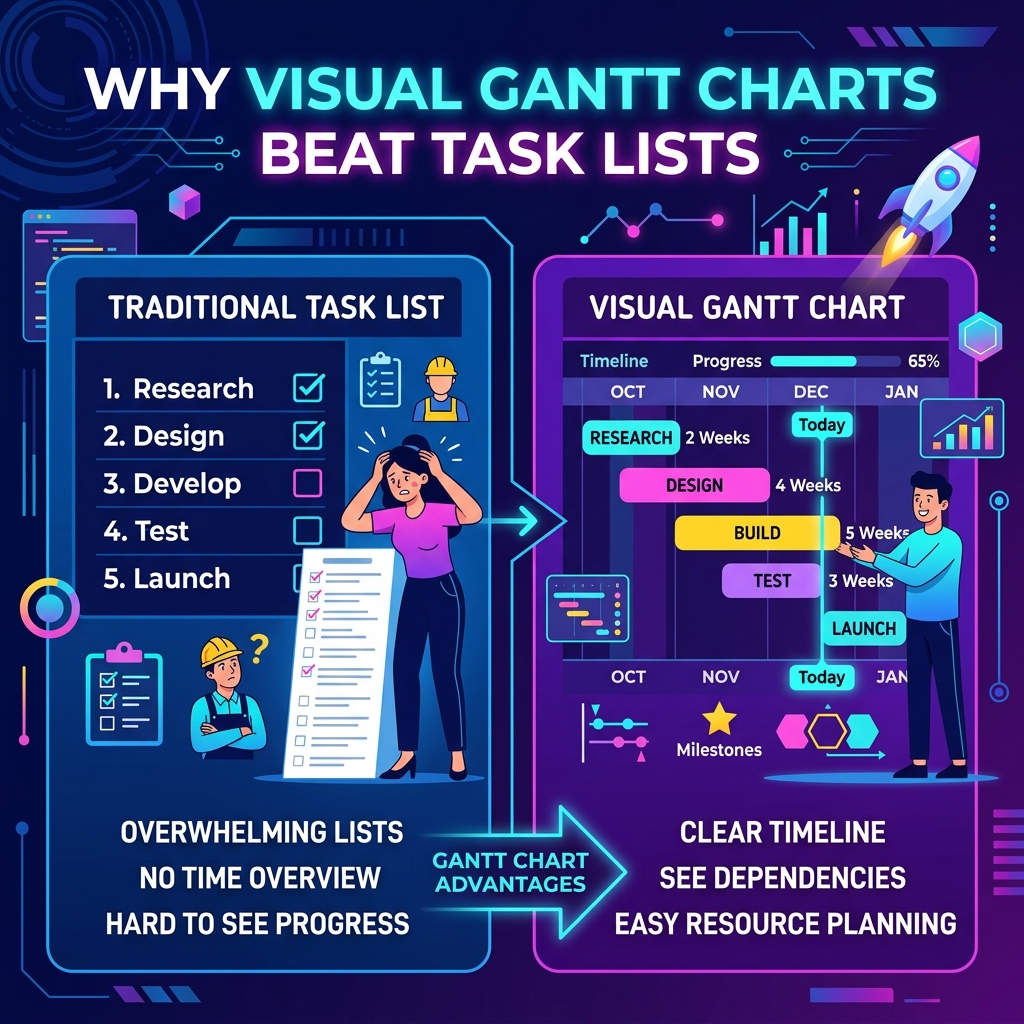
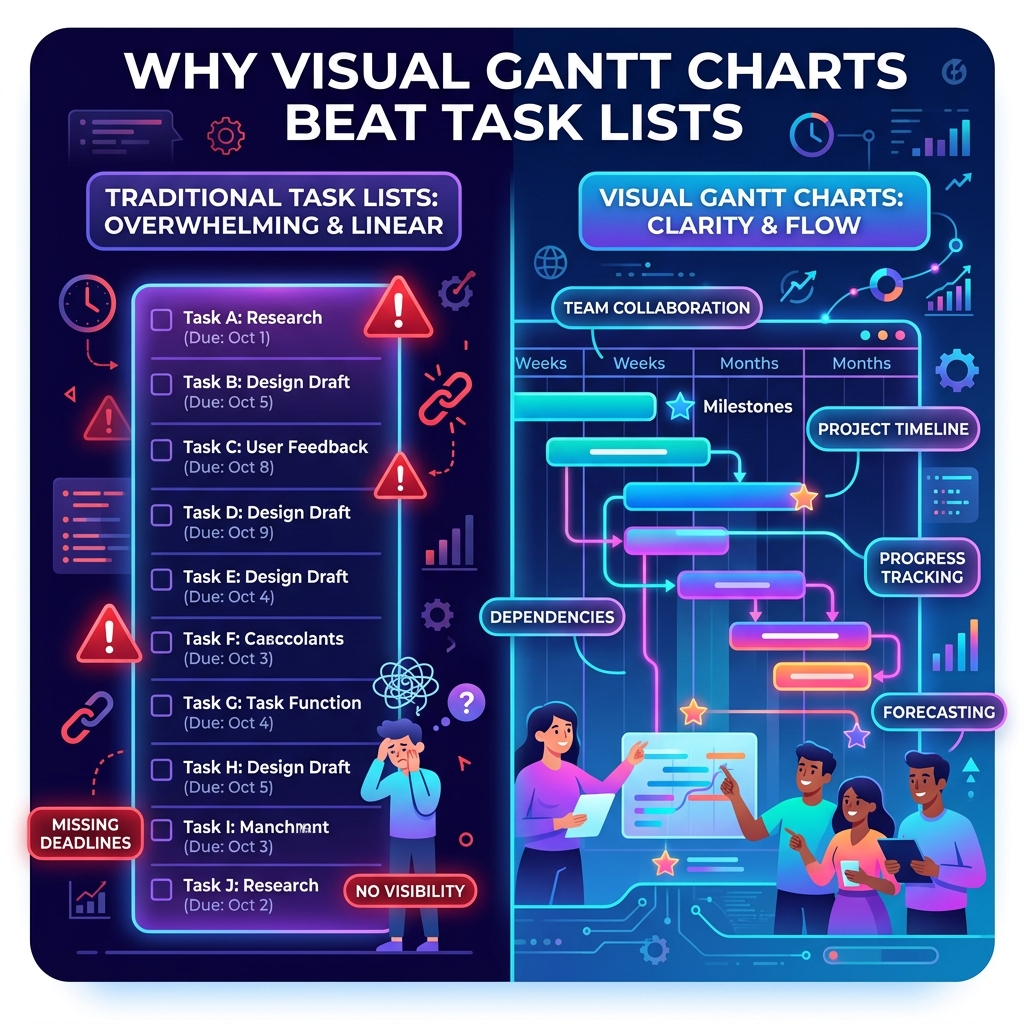
A Gantt chart makes all of this visible at a glance. Tasks are laid out on a horizontal timeline, with bars representing duration and arrows showing dependencies. You can immediately see the critical path, identify bottlenecks, and spot overallocation. The spatial layout maps directly to how time actually works — left to right, past to future.
Cognitive Load and Visual Processing
Research in cognitive science consistently shows that humans process spatial and visual information far more efficiently than text-based lists. A 2019 study published in the Journal of Cognitive Engineering and Decision Making found that participants using timeline visualizations identified scheduling conflicts 40% faster than those using tabular data.
This isn't surprising when you consider how the brain works. The visual cortex processes spatial relationships in parallel — you can see the "shape" of a two-month project in a single fixation. Reading a task list, by contrast, requires serial processing: you must hold earlier items in working memory while scanning forward, mentally constructing the temporal relationships that a Gantt chart displays natively.
The "Shape" of a Project
Experienced project managers often talk about the "shape" of a project — phases that taper, middle sections that bulge with parallel work, and a final convergence toward launch. This shape is invisible in a task list but immediately apparent in a Gantt chart. When you can see the shape, you can manage it: compressing parallel phases, extending sequential ones, or rebalancing resources to smooth out peaks.
Dependencies: The Hidden Architecture of Projects
The most dangerous information a task list hides is dependencies. In any non-trivial project, tasks form a directed acyclic graph (DAG): some tasks must complete before others can begin. The "Architecture Design" must finish before "Implementation" starts. "QA Testing" depends on a stable build from "Development." "Client Review" can't happen until "Design Mockups" are approved.
In a task list, these relationships exist only in the project manager's head. When that person goes on vacation, gets sick, or simply forgets, the team loses the dependency map. New team members can't reconstruct it. Stakeholders asking "why is this delayed?" get hand-wavy answers instead of a clear visual chain showing that Task C is late because Task A slipped, which pushed Task B, which blocked Task C.
In Vedratic Project Manager, dependencies are first-class citizens. You link tasks visually, and the tool automatically calculates cascading effects. Move one task, and every dependent task shifts accordingly. This isn't just convenience — it's structural integrity for your plan.
Buffer Management: Planning for Reality
No plan survives contact with reality unchanged. Tasks take longer than estimated, stakeholders request changes, external dependencies slip. The question isn't whether your plan will change, but how well it absorbs change.
Task lists offer no mechanism for buffer management. You can add a "Buffer" task at the bottom of the list, but it has no relationship to the tasks it's supposed to protect. A Gantt chart, by contrast, lets you embed buffers within the timeline — adding strategic padding after high-risk tasks, before critical milestones, or at phase boundaries.
Vedratic's Project Manager takes this further with configurable buffer settings per task type. You can set a global buffer of 2 days for Design tasks (which often need revision cycles), 1 day for Development tasks, and 3 days for Testing tasks (where unexpected bugs are common). The tool applies these buffers automatically, creating a plan that's realistic from day one rather than optimistically fragile.
The Validation Complexity Multiplier
One of the unique features of Vedratic Project Manager is the Validation Complexity multiplier. This accounts for the back-and-forth review cycles that inflate task duration in real projects. A task might take 3 days of pure work, but if it requires two rounds of stakeholder review with 2-day turnaround each, the calendar duration is actually 7+ days.
Traditional tools ignore this entirely. You either pad your estimates manually (leading to inconsistency) or discover the inflation after the fact (leading to missed deadlines). The Validation Complexity multiplier makes this explicit and configurable:
- 0.0 — No review overhead (internal utility tasks).
- 0.5 — One routine review cycle (adds 50% to duration).
- 1.0 — Moderate stakeholder involvement (doubles duration).
- 2.0 — Extensive multi-party approval (triples duration).
When Task Lists Still Win
To be fair, task lists aren't always wrong. They're ideal for:
- Personal daily to-do lists — When you have 5-10 independent items with no temporal relationships.
- Sprint backlogs — Short-term, well-scoped work where everything happens in a single time window.
- Shopping lists and checklists — Sequential, disposable lists with no planning horizon.
But the moment your project spans more than two weeks, involves more than one person, or has tasks that depend on each other, a visual timeline becomes not just useful but essential. The cognitive cost of maintaining a mental model of the project's temporal structure — information a task list forces you to keep in your head — quickly exceeds the minor learning curve of a Gantt chart.
Getting Started
If you've been managing projects with flat task lists and feeling the friction, try Vedratic Project Manager. It's free, runs entirely in your browser, stores data locally for complete privacy, and exports to Mermaid, SVG, and JSON. No sign-up, no paywall, no data collection. Just open it and start planning.
Your future self — and your team — will thank you for making the invisible visible.